Introduction
I’ve written about breeze-up sales in a previous blog piece, concluding that breeze-up sale graduates have much the same profile on the track as yearling sales graduates. First time out ratings are similar, as is the level of improvement from first run to best run.
Breeze-up sales are not without their critics. A number of these criticisms are addressed in an article I co-authored with James Willoughby for Mark Johnston’s March 2015 edition of The Kingsley Klarion. James and I consulted for Mark and Simon Crisford at the breeze-up sales in 2015, and also consulted at the yearling and foal sales in 2015 for a number of clients.
The focus of this article is to examine the relationship between breeze times, sales prices, run frequency and subsequent racecourse performance, but aggregated to the consignor level. This enables the following questions to be answered:
- Do consignors that produce faster breezers achieve higher sales prices?
- Do consignors that produce faster breezers achieve higher or lower subsequent ratings?
- Do consignors that produce faster breezers achieve it at the expense of subsequently running less often?
Data
We have collected breeze times at a variety of European breeze-up sales in the last few years. Our proprietary database runs to over 2,000 lots offered and links each horse to their subsequent racecourse performance. In the analysis below information is aggregated to the consignor level, with medians used as the summary measure. Averages were also examined and show similar results. Consignors offering fewer than 15 lots in total in our dataset were excluded from the analysis.
Analysis
Breeze Times and Sales Prices
In Graph 1 below the relationship between median relative breeze time on the x-axis and median sales price on the y-axis is shown. Each point represents a consignor. Consignors whose graduates breeze more quickly are on the left hand side of the graph, higher prices are at the top of the graph. There is little relationship between breeze time and prices achieved. Those consignors that typically produces fast breezers do not guarantee high sales aggregates for their lots.
 Graph 1: breeze times & sales prices
Breeze Times and Subsequent Ratings
In Graph 2 below the relationship between median relative breeze time on the x-axis and subsequent median of maximum Racing Post Rating (RPR) on the y-axis is shown. Consignors whose graduates breeze more quickly are on the left hand side of the graph. There is little relationship. Those consignors that typically produces fast breezers do not guarantee high or low ratings for their lots.
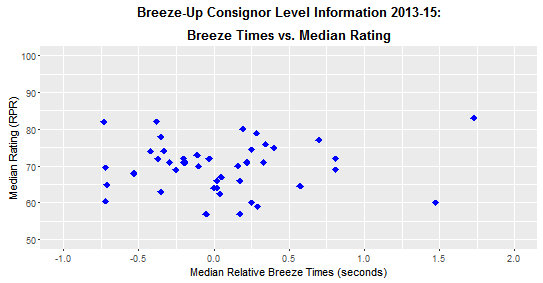
Graph 2: breeze times & subsequent ratings
Breeze Times and Run Frequency
In Graph 3 below the relationship between median relative breeze time on the x-axis and run frequency on the y-axis is shown. Consignors whose graduates breeze more quickly are on the left hand side of the graph. There is little relationship. Consignors with fast breezers do not appear to compromise the subsequent ability of horses to be able to run regularly.

Graph 3: breeze times & run frequency
Previous and Current Sale Prices
In Graph 4 below the relationship between previous (x-axis) and current (y-axis) sale prices are shown. There is a strong relationship. The strongest predictor of the aggregate sales price a consignor will achieve at the breeze-ups is the previous aggregate price paid at the yearling sales. Previous prices will reflect the view of the yearling market regarding pedigree quality, physical attributes and conformation. With the breeze-up sales taking place less than a year after the yearling sales, it is unsurprising that the attributes that were important in determining price at the yearling sales were also important to prospective purchasers at the breeze-ups.
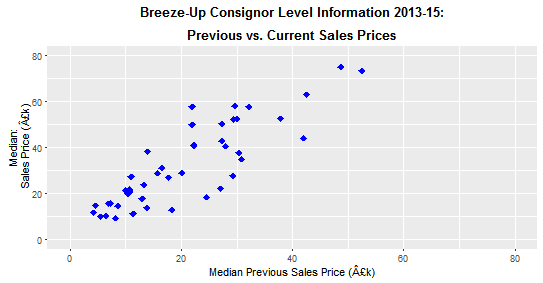
Graph 4: current and previous sale prices
