Link to the Powerpoint presentation: TrainerMoves31Jan15
Click on link to go to the podcast on YouTube
Click here for the Soundcloud version of the podcast
Link to the Powerpoint presentation: TrainerMoves31Jan15
Click on link to go to the podcast on YouTube
Click here for the Soundcloud version of the podcast
Introduction
On day two of the November 2013 Cheltenham meeting David Pipe drew a blank from his seven runners. For many people this result pointed to the Pipe stable being out of form. But whatever might have been ailing the yard on Saturday had disappeared by Sunday morning, with four winners, including The Greatwood, one of the most competitive handicap hurdles in the calendar. No doubt on Sunday evening the Pipe yard was marked out as one to follow. So what of trainer form, is it possible to identify yards that are in or out of form? In the woefully misnamed ‘Statistics’ section of the Racing Post the ‘Hot Trainers’ table uses Strike Rate (winners to runners) over the last 14 days , whilst the ‘In Form’ table in the ‘Trainerspot GB’ table uses Run To Form, again over the last fortnight. Neither table is useful. Both are based upon too few runners to be able to draw any meaningful conclusions. These tables are an excellent example of attempting to draw inference from a small information set – whilst this instinct helped us survive when faced with perceived mortal dangers in the past, the very same instincts are likely to mislead in the more prosaic setting of horse racing. Whilst the data in the ‘In Form’ table isn’t useful, this is only because there are too few observations to be able to draw any firm conclusions. However, the idea of considering trainer form as an average or median of how close to form the horses under the trainers care are running makes intuitive sense.
The analysis that underpins this piece was carried out in the R statistical environment accessing Raceform Interactive data focussing on the 2010-11 and 2011-12 National Hunt seasons. Thanks to Simon Rowlands and James Willoughby for their input.
Trainer Form Variable Definitions
The starting point for the analysis that follows is to define and calculate a Run To Form (RTF) variable. RTF is defined as follows: the Racing Post Rating (RPR) achieved by each horse in a race subtracted from the maximum RPR achieved by each horse in its runs up to and including the race in question. A horse has to have run more than three times to qualify for consideration. This filter is used to reduce the influence of lightly raced progressive horses. The maximum value RTF can take is zero.
Trainer Form Absolute (TFA)
The next step is to define and calculate a measure of trainer form. Trainer Form Absolute (TFA) is the median RTF for all the runners of a trainer over a particular time period. Using the 2010-11 National Hunt season Graph 1 shows a histogram of TFA for those trainers that had at least 50 runners over the season. 132 trainers qualified. Note the negative skew. This is a common characteristic of form data in horse racing. It is difficult to run close to form wheras there are many and varied reasons for horses running below form. The negative skew in RTF at the horse level aggregates to negative skew in TFA at the trainer level. Graph 2 shows the same information as a Box Plot.
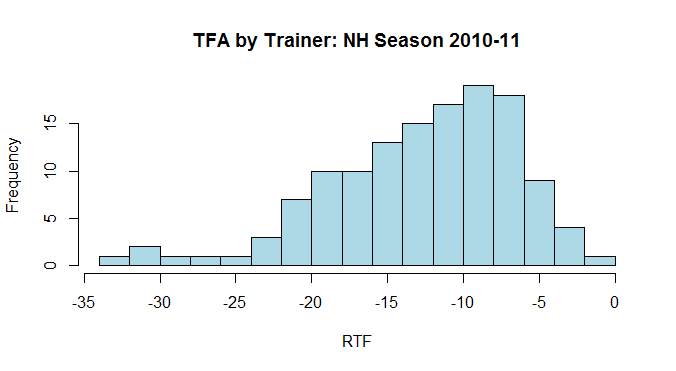
Graph 1: Distribution of trainer TFA NH season 2010-11

Graph 2: Box Plot of trainer TFA NH season 2010-11
So does a ranking of TFA indicate in form trainers at the top and out of form trainers at the bottom? Inspection of Graphs 1 and 2 highlights the problem with using TFA as a measure of trainer form. The range of TFA across trainers is so wide that the top and bottom of the TFA list won’t change often enough to be able to identify trainers in and out of form – for example if Nicky Henderson normally runs at a -5lb TFA and is currently running at -8lb TFA he would still be near the top of the TFA list, wheras he is running 3lb below his normal TFA rate. It is also of note that the variability of TFA per trainer is correlated with their TFA. Either the better horses, who are at the better yards, run more consistently, or the better trainers are able to get their horses, who are better than those elsewhere, to run more consistently. Or a combination of the two. In this context better means those yards with the highest TFA values.
Trainer Form Relative (TFR)
Given the concerns about using TFA a measure of relative run to form can be defined and calculated that takes into account the usual RTF per trainer. Trainer Form Relative (TFR) is defined as the difference between TFA in a particular time period and TFA in a previous time period. TFR enables a direct comparison between trainers with widely different absolute levels of form (TFAs). Now Nicky Henderson’s -3lb TFR can be compared with a trainer whose TFA is normally -12lb and is currently running at -9lb, to give a +3lb TFR.
For the analysis that follows TFR is calculated for each of the seven months October 2011 through to April 2012. TFRs are calculated by taking the TFA in each month by trainer and subtracting the TFA posted by trainer for the previous season 2010-11. So, starting with October 2011, how is its TFR related to the TFRs posted one month later? Graph 3 below shows a significant relationship. At first sight this appears to be clear evidence that trainer form in October 2011 helps predict trainer form in November 2011.

Graph 3: Relationship between TFR October to November 2011
What happens if we compare TFR in October 2011 with months further out? If form is temporary the relationship should decline through time. If October form predicts November form, it shouldn’t predict December form to the same degree. In the jargon we can postulate an autoregressive AR(1) process. What we see in the data is the relationship shown in Graph 3 is as strong between October and November as it is between October and other months. See Table 1 below for correlation coefficients between t and t+1, t+2, t+3 using November 2011 as month t.
Correlation of November 2011 TFR with
December 2011 0.44
January 2012 0.51
February 2012 0.43
March 2012 0.47
April 2012 0.37
Table 1: Correlation of TFR months t with t+1, t+2, t+3 etc
We shouldn’t observe the same level of correlation across the months. It suggests form has a permanent component to it – an oxymoron. So how to explain this result? Imagine we can fast forward one year. We calculate TFA per trainer based upon the season 2011-12. This enables us to compare the results of a trainer in 2010-11 with the next season 2011-12. If we classify TFR as ABOVE or BELOW zero, and then further classify according to whether a trainer had a BETTER or WORSE season in 2011-12 relative to 2010-11, we see how RTF looks month by month in Table 2 below.
BETTER 2011-12 form WORSE 2011-12 form
ABOVE BELOW ABOVE BELOW
ABOVE 76 42 8 28
BELOW 33 16 29 109
Table 2: classification of form by month by year
Remember we have peaked into the future in calculating Table 2. It isn’t available until the end of the second season. The number of observations in the ABOVE-ABOVE and BELOW-BELOW categories are too high for the TFR measure to be useful as an indicator of form. In other words when a trainer is ABOVE or BELOW form in a particular month it is likely that they will continue in that category for the next month and the next month after that and for the duration of the season. The problem here is that the comparison used in the TFR calculation, namely the form of the trainer from the previous season, is likely to suffer from bias. For some trainers it will be higher or lower than the true level of form a trainer can expect, and for those that posted towards the extremes of TFA they are likely to revert back to some degree in the next season. Bias such as this is difficult to remove and as a result relative measures of trainer form such as TFR are as flawed in their own way as absolute measures of trainer from such as TFA.
Summary
I started this analysis with the prior view that trainer form probably exists. My view now is that it if it does exist it is very difficult to measure. Absolute measures of trainer form do not exhibit enough variability, wheras relative measures have problems in deciding on an appropriate comparison. For some the measures of trainer form defined above might be too simplistic, arguing that more complex definitions are required. This is entirely possible. But as complexity of definition increases, particularly if it is one of many derivations tried, so does the risk that the measure will work only for the sample of data on which it was tried. If you torture the data for long enough it will tell you anything.
There is another possible use of trainer form – but more in how it is perceived by the market. Consider Graph 4 below. It shows TFA on the x-axis and Strike Rate on the y-axis by trainer for the 2010-11 season. It is the same data expressed in different ways.
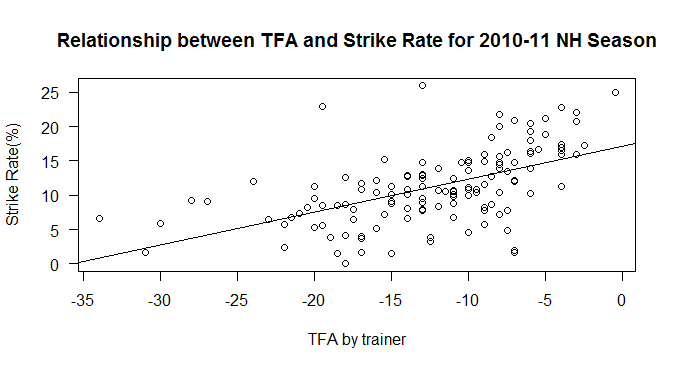
Graph 4: Strike Rate vs trainer form
Strike Rate is a popular measure of form, RTF (and its variants TFA and TFR) less so. Yet Strike Rate is noisier and contains less information than RTF. Given the popularity of trainer form as an idea, and the popularity of Strike Rate as a proxy for trainer form, it is possible that the runners of trainers with a high/low Strike Rate relative to their TFA could have odds that are too far away from their correct values as the market considers these trainers, based upon a faulty premise, to be in or out of form. Armed with the appropriate data this is a testable proposition.
Introduction
The champion trainer for the season is decided using total prize money earned. This measure favours the very largest training yards, particularly those that have access to the offspring of top stallions. As a result it is somewhat unsatisfactory measure of training yard success. Since Impact Values (IVs) correct for yard size by taking into account the number of runners as well as number of winners, the playing field between yards of differing sizes is, to a good degree, made level when this measure is used. Whilst there are also limitations with using this measure across all races and for all trainers, the net is cast wider. In this blog post IVs for different categories of race, namely maidens, handicaps and pattern races, are calculated, both raw and adjusted for Sire IVs (SA), then combined to produce a composite IV measure. Measuring IVs in different race categories enables a more complete picture of training yard success to be built. A by-product of the approach used is that trainers whose results are most and least influenced by the success of particular stallions can be identified.
Data & Methodology
The analysis that underpins this piece was carried out in the R statistical environment accessing Raceform Interactive data for the 2012 flat season. The R code is posted elsewhere for interested readers. To qualify for inclusion in the tables that follow, a training yard must have sent out at least 50 runners in handicaps and 100 runners in total over the course of the 2012 flat season, and be based in Great Britain (GB). A total of 139 yards met this criteria. These yards were then split into 2 groups according to how many different horses had been raced – 66 yards raced at least 40 different horses and are the focus of the analysis in this blog piece. The other 73 yards, smaller in size, were analysed separately and may be the subject of a further blog post. Since we know that on average larger yards deliver higher IVs than smaller yards (see my earlier blog post on this subject) smaller yards that perform well may not have appeared in the listings reported below and it is more appropriate to analyse their results separately.
Impact Values – Maidens
Maiden race IVs are likely to favour large yards with access to potential pattern class horses. Table 1 shows the top 10 yards ranked by sire adjusted IV in maidens. Raw IVs are also reported. Note the dominance of the Richard Hannon yard and the small difference between raw and sire adjusted IVs compared with the larger differences between IVs for Saeed bin Suroor and William Haggas. The large number of horses at the Hannon’s yard appears to confer a substantial advantage in being able to place horses to good effect within maidens. The same comments apply to Richard Fahey’s results. In both yards the large number of horses at their disposal appears to outweigh any advantage given to other yards via ostensibly better bred horses.
| Rank | Trainer | wins | runs | IV raw | IV SA |
| 1 | Mrs K Burke | 14 | 49 | 2.70 | 3.02 |
| 2 | Saeed bin Suroor | 33 | 121 | 2.58 | 1.93 |
| 3 | Peter Chapple-Hyam | 14 | 68 | 1.95 | 1.81 |
| 4 | William Haggas | 42 | 182 | 2.18 | 1.73 |
| 5 | Henry Candy | 9 | 63 | 1.35 | 1.63 |
| 6 | Richard Hannon | 82 | 471 | 1.64 | 1.58 |
| 7 | Jeremy Noseda | 18 | 98 | 1.74 | 1.57 |
| 8 | John Quinn | 7 | 39 | 1.70 | 1.55 |
| 9 | Richard Fahey | 35 | 225 | 1.47 | 1.49 |
| 10 | David Simcock | 20 | 108 | 1.75 | 1.42 |
Table 1: Top 10 training yards by Sire adjusted IV in maidens
Impact Values – Handicaps
Table 2 shows the top 10 yards ranked by Sire adjusted IV in handicaps. Raw IVs are also reported. Sir Mark Prescott Bt tops the table, although in common with the majority of the trainers in the top 10 his Sire adjusted IV is substantially lower than his raw IV. Noteworthy are the results of Chris Wall and Michael Appleby, whose IVs are hardly affected by the relative success of the sires of their horses in training. Part of this result is due to their lack of relative success in maidens, suggesting their horses are likely to be highly competitive when they move out of maidens into handicap company – Chris Wall’s IV in maidens was 0.43, whilst Michael Appelby sent out no maiden winners in 2012. In contrast Sir Mark Prescott Bt, along with 6 other trainers, delivered IVs above 1 in both maiden and handicap company. The other 6 were Marcus Tregoning, Luca Cumani, Sir Michael Stoute, Ed Dunlop, James Fanshawe, Roger Varian and Mick Channon.
| Rank | Trainer | wins | runs | IV raw | IV SA |
| 1 | Sir Mark Prescott Bt | 31 | 131 | 2.45 | 1.98 |
| 2 | Marcus Tregoning | 16 | 83 | 1.99 | 1.88 |
| 3 | Sir Michael Stoute | 25 | 115 | 2.25 | 1.83 |
| 4 | Luca Cumani | 24 | 129 | 1.92 | 1.75 |
| 5 | Chris Wall | 18 | 104 | 1.79 | 1.74 |
| 6 | Roger Varian | 28 | 155 | 1.87 | 1.61 |
| 7 | Peter Chapple-Hyam | 10 | 63 | 1.64 | 1.53 |
| 8 | William Haggas | 30 | 166 | 1.87 | 1.52 |
| 9 | Michael Appleby | 24 | 162 | 1.53 | 1.52 |
| 10 | Tom Dascombe | 33 | 211 | 1.62 | 1.51 |
Table 2: Top 10 training yards by Sire adjusted IV in handicaps
Impact Values – Pattern Races
Table 3 shows the top 20 yards ranked by Sire adjusted IV in pattern races. Raw IVs are also reported. The results are more difficult to interpret than maidens and handicaps for individual trainers because of small sample sizes. The Richard Hannon and John Gosden yards dominate the table in terms of number of winners and runners, however the Sire adjusted IVs for both trainers are noticeably lower than their raw IVs. It is possible this result is an artefact created by their substantial relative success in producing pattern class winners during the 2012 flat season. A number of yards that perform well on the IV measure in maiden company do not appear in the table below.
| Rank | Trainer | wins | runs | IV raw | IV SA |
| 1 | Ann Duffield | 2 | 4 | 4.47 | 6.12 |
| 2 | Alan McCabe | 1 | 5 | 1.79 | 2.92 |
| 3 | David Simcock | 2 | 14 | 1.28 | 2.05 |
| 4 | Sir Henry Cecil | 16 | 60 | 2.39 | 1.89 |
| 5 | David O’Meara | 4 | 20 | 1.79 | 1.89 |
| 6 | Roger Charlton | 10 | 46 | 1.94 | 1.84 |
| 7 | David Barron | 2 | 13 | 1.38 | 1.58 |
| 8 | Roger Varian | 9 | 52 | 1.55 | 1.56 |
| 9 | Sir Michael Stoute | 6 | 41 | 1.31 | 1.42 |
| 10 | Richard Fahey | 9 | 81 | 0.99 | 1.36 |
| 11 | Mrs K Burke | 1 | 12 | 0.75 | 1.32 |
| 12 | Chris Wall | 2 | 15 | 1.19 | 1.27 |
| 13 | Clive Cox | 7 | 35 | 1.79 | 1.27 |
| 14 | Henry Candy | 1 | 11 | 0.81 | 1.23 |
| 15 | Richard Hannon | 21 | 139 | 1.35 | 1.16 |
| 16 | Mark Johnston | 8 | 61 | 1.17 | 1.15 |
| 17 | Marcus Tregoning | 2 | 17 | 1.05 | 1.15 |
| 18 | Luca Cumani | 4 | 26 | 1.38 | 1.10 |
| 19 | John Gosden | 23 | 130 | 1.58 | 1.09 |
| 20 | Mahmood Al Zarooni | 9 | 69 | 1.17 | 1.06 |
Table 3: Top 10 training yards by Sire adjusted IV in pattern races
Impact Values – Composite Measure
A composite IV is calculated by combining together the IVs for maidens, handicaps and pattern races by trainer, weighting by the proportion of runs that each trainer had in each category. Thus a trainer without runners in pattern races would not be penalised for his non-participation, and the biggest contributor to each trainer’s IV is from the category of race in which they had the biggest proportion of runners. The composite measure was also adjusted for Sire IV. Using this measure Sir Mark Prescott Bt was the top trainer on the flat in 2012, followed by William Haggas and Marcus Tregoning. Noteworthy results were produced by Henry Candy, David Barron, Michael Appleby and Chris Wall, each of whom saw their IV increase after taking the Sire IV adjustment into account. For 16 of the 20 trainers we see the opposite, suggesting that the adjustment for bloodstock quality used here via a Sire adjusted IV does not go far enough. I will return to this subject in another blog article. Thanks to Declan Meagher and others for making this point on the separate blog post “Do Small Training Yards Punch Above Their Weight?’.
| Rank | Trainer | IV raw | IV SA | ||
| 1 | Sir Mark Prescott Bt | 1.81 | 1.55 | ||
| 2 | William Haggas | 1.87 | 1.55 | ||
| 3 | Marcus Tregoning | 1.62 | 1.53 | ||
| 4 | Saeed bin Suroor | 1.86 | 1.52 | ||
| 5 | Roger Varian | 1.76 | 1.51 | ||
| 6 | Peter Chapple-Hyam | 1.59 | 1.51 | ||
| 7 | Henry Candy | 1.31 | 1.49 | ||
| 8 | Sir Michael Stoute | 1.91 | 1.48 | ||
| 9 | Sir Henry Cecil | 1.86 | 1.42 | ||
| 10 | David Barron | 1.25 | 1.42 | ||
| 11 | Richard Hannon | 1.52 | 1.41 | ||
| 12 | Luca Cumani | 1.59 | 1.40 | ||
| 13 | Jeremy Noseda | 1.53 | 1.39 | ||
| 14 | Mrs K Burke | 1.39 | 1.38 | ||
| 15 | Michael Appleby | 1.29 | 1.36 | ||
| 16 | Chris Wall | 1.34 | 1.35 | ||
| 17 | Ralph Beckett | 1.64 | 1.34 | ||
| 18 | Roger Charlton | 1.49 | 1.30 | ||
| 19 | Tom Dascombe | 1.37 | 1.29 | ||
| 20 | David Simcock | 1.34 | 1.27 |
Table 4: Top 20 training yards by composite IV adjusted for Sire
Training Yards Success & Relationship with Sire Quality
How many training yards are able to deliver improved IVs after the Sire adjustment is taken into account? Remember for successful yards the natural direction for the Sire adjustment to take your IV is downwards. This is because the better quality Sires make an outsized contribution in terms of siring winners. So the yards that are able to increase their IVs after this adjustment is applied are worthy of note. There are 10 yards out of the 66 – see Table 5 below – that were able to deliver an adjusted composite IV both greater than 1 and higher than their raw composite IV. Henry Candy and David Barron’s results are noteworthy.
| Rank | Trainer | IV comp | IV comp SA | Difference | |
| 1 | Henry Candy | 1.31 | 1.49 | 0.18 | |
| 2 | David Barron | 1.25 | 1.42 | 0.18 | |
| 3 | Michael Appleby | 1.29 | 1.36 | 0.07 | |
| 4 | Chris Wall | 1.34 | 1.35 | 0.02 | |
| 5 | Brian Ellison | 1.25 | 1.26 | 0.01 | |
| 6 | Kevin Ryan | 1.11 | 1.22 | 0.11 | |
| 7 | James Given | 1.01 | 1.15 | 0.14 | |
| 8 | John Quinn | 1.12 | 1.15 | 0.03 | |
| 9 | Marco Botti | 1.06 | 1.06 | 0.01 | |
| 10 | Alan Swinbank | 1.00 | 1.02 | 0.01 |
Table 5: Top 10 trainers with improved IVs after Sire adjustment ranked on Sire adjusted IV
What of yards that see falls in their IVs after the Sire adjustment is applied? Table 6 ranks the 10 training yards most affected by the Sire IV adjustment. These yards are still highly successful – they still post IVs substantially greater than 1. However, using this metric suggests that these training yards are more reliant than others on the quality of their bloodstock for their success.
| Rank | Trainer | IVcomp | IVcomp SA | ||
| 57 | Roger Varian | 1.76 | 1.51 | ||
| 58 | Sir Mark Prescott Bt | 1.81 | 1.55 | ||
| 59 | James Fanshawe | 1.50 | 1.24 | ||
| 60 | Ralph Beckett | 1.64 | 1.34 | ||
| 61 | Mahmood Al Zarooni | 1.51 | 1.19 | ||
| 62 | William Haggas | 1.87 | 1.55 | ||
| 63 | Saeed bin Suroor | 1.86 | 1.52 | ||
| 64 | John Gosden | 1.65 | 1.24 | ||
| 65 | Sir Michael Stoute | 1.91 | 1.48 | ||
| 66 | Sir Henry Cecil | 1.86 | 1.42 |
Table 6: Bottom 10 trainers with reduced IVs after Sire adjustment
Summary
In this paper the criteria used for measuring training yard success is a Sire Adjusted Impact Value derived from results delivered in maidens, handicaps and pattern races. Using this measure Sir Mark Prescott Bt was the top trainer on the flat in 2012. It is probable the Sire IV adjustment used does not go far enough in terms of correcting for quality and another blog post will address this point. A small number of trainers produce IVs that improve after an adjustment for Sire quality is made. These training yards are of particular interest. .
Introduction
When George Margeson’s Lucky Kristale won the Group 2 Duchess of Cambridge stakes in July 2013 it was a newsworthy event. Not only because she won at 20-1, but because she is trained at a yard that has so far sent out fewer than 20 different horses to race on the flat in 2013. Lucky Kristale’s subsequent win in the Group 2 Lowther Stakes at York showed her Newmarket win to be no fluke, with an engagement in the Group 1 Cheveley Park likely to be next on the agenda. Small training yards don’t often win Pattern races in the UK. Of 266 such races that took place on the flat in 2012, just 6 were won by yards that had fewer than 25 horses in training. So how well do small yards perform? Is the flexibility of training a small string outweighed by the advantages in having a large number of horses in training? Are smaller yards able to judge when they have a horse that is capable of winning a Pattern race, and how good are they at placing their horses in handicaps? In short, do small training yards punch above their weight?
These questions are best answered by considering yards in aggregate. It is difficult to draw strong conclusions about an individual trainer’s ability when they don’t have many horses in training, however we can classify trainers by yard size and then examine how each yard classification – small, medium and large – performs. The number of horses in each category means that, assuming the question is framed correctly, the conclusions will have some significance.
The analysis that underpins this piece was carried out in the R statistical environment accessing Raceform Interactive data. The R code is posted elsewhere for interested readers.
Training Yard Classification
Training yards were classified as Tiny, Small, Medium and Large using the criteria in Table 1 below. The Tiny category was included so that results for the Small category were not influenced by yards that have the occasional runner. All races under both flat and NH codes in that took place in Great Britain (GB) and Ireland in the 12 months to the date of the 2012 November Handicap were considered. The number of different horses that ran in this 12 month period determined the size classification of each trainer. An Overseas category is included so that the occasional runner from abroad is not misclassified.
| Yard Size | Horses in Training | Yards | Number of Horses | Average | |||||
| Tiny | fewer than 5 | 957 | 1,915 | 2 | |||||
| Small | between 5 and 25 | 558 | 7,253 | 13 | |||||
| Medium | between 25 and 75 | 203 | 8,533 | 42 | |||||
| Large | more than 75 | 56 | 6,967 | 124 | |||||
| Overseas | based outside GB/ Ireland |
Table 1: Yard classification, yard and horse numbers
Table 1 shows that a substantial number of horses are in training in small yards. In aggregate there are more horses in training in Small/Tiny yards than in any other category. This suggests a good degree of success on the part of smaller yards, in being able to attract and retain horses in training.
Pattern Race Analysis
With yards now classified by size, the results of all 266 Pattern races that took place on the Flat in 2012 were examined by yard size and are presented in Table 2. The number of winners and runners and Impact Values (IV) are presented. Impact Values are defined as IV= %winners/%runners and represent opportunity adjusted performance. An IV of 1 represents what you would expect given the opportunity, less than 1 is worse than expected, greater than 1 better than expected.
| Yard Size | Winners | Runners | %Winners | %Runners | IV | |||||
| Tiny | 0 | 14 | 0.0% | 0.6% | 0.00 | |||||
| Small | 5 | 145 | 1.9% | 6.0% | 0.31 | |||||
| Medium | 57 | 736 | 21.4% | 30.7% | 0.70 | |||||
| Large | 194 | 1,437 | 72.9% | 65.4% | 1.22 | |||||
| Overseas | 10 | 65 | 0.0% | 0.0% | 0.00 | |||||
| TOTAL | 266 | 2,397 |
Table 2: Pattern race results 2012 wins/runs/IVs by stable classification
Small yards were not well represented in Pattern races in 2012, comprising fewer than 7% of runners. In addition, when small yards did have runners, they do not win as often as would be expected, posting an IV of 0.31. Medium sized yards do not win Pattern races as often as would be expected either, posting an IV of 0.70. Larger yards, whilst having the largest proportion of runners, delivered more winners than would be expected, with an IV of 1.22. From a small sample overseas yards were adept at targeting GB Pattern races in 2012, with an IV of 1.39.
The information in Table 2 does not take into account the quality of the horses that take part in each category of yard. Larger yards are likely to have better quality horses and thus more likely to win Pattern Races. There are a number of ways in which this quality bias could be corrected. One option would be to take into account the cost of the horses in each type of yard. However not all horses pass through the sales ring, so any adjustment based upon sales information would be incomplete. Another option, adopted here, is to adjust the number of runners in each stable size category by the Impact Value of the sire of each of the runners in Pattern races in 2012. Thus if Galileo’s stock had an IV of 2, and his stock ran 10 times in Pattern races, the number of runs would be adjusted to give a sire adjusted run number of 20. Since the successful sires have a higher representation at the larger training yards, this approach takes into account the lower probability that small yards win fewer Pattern races due to the breeding of their horses in training. The effect of this adjustment is to increase the number of runners (and thus decrease the IV) from stables with horses by successful sires and decrease the number of runners (and thus increase IVs) from stables with horses by less successful sires.
| Yard Size | Winners | Runners | Runners Adjusted | IV raw | IV adjusted | ||||||
| Tiny | 0 | 14 | 12 | 0.00 | 0.00 | ||||||
| Small | 5 | 145 | 96 | 0.31 | 0.47 | ||||||
| Medium | 57 | 736 | 638 | 0.70 | 0.81 | ||||||
| Large | 194 | 1,437 | 1,567 | 1.22 | 1.12 | ||||||
| Overseas | 10 | 65 | 85 | 1.39 | 1.06 | ||||||
| TOTAL | 266 | 2,397 | 2,397 |
Table 3: Pattern race results 2012 wins/runs/IVs/adjusted IVs by stable classification
The Sire adjustment has reduced the number of runners from small yards from 145 to 96. Medium sized yards also receive some relief. However the adjustment is not enough to take the IVs for small and medium sized yards to 1, with small yards now reporting an IV of 0.47 and medium yards 0.81. Larger yards still have more winners than expected relative to small and medium sized yards, even after making an adjustment for the quality of the horses in each yard category.
Handicap Race Analysis
Are the results seen for Pattern races replicated in Handicaps? Since handicaps are a test of the best horse at the weights, an additional set of skills are brought to bear in placing horses in them. Quality of horse should be less important in these types of race.
| Yard Size | Winners | Runners | %Winners | %Runners | IV | |||||
| Tiny | 33 | 524 | 1.1% | 1.6% | 0.65 | |||||
| Small | 644 | 8,406 | 21.0% | 26.4% | 0.80 | |||||
| Medium | 1,256 | 13,129 | 41.0% | 41.3% | 0.99 | |||||
| Large | 1,128 | 9,741 | 36.9% | 30.6% | 1.20 | |||||
| Overseas | 0 | 8 | 0.0% | 0.0% | 0.00 | |||||
| TOTAL | 3,061 | 31,808 |
Table 4: Handicap race results 2012 wins/runs/IVs by stable classification
In handicaps small yards have and IV of 0.80, so 20% fewer winners than expected. Medium sized yards deliver wins in-line with expectations, whilst large yards deliver more wins in handicaps than expected with an IV of 1.20. Results when an adjustment for horse quality via Sire Impact Values is applied are reported in Table 5 below.
| Yard Size | Winners | Runners | Runners Adjusted | IV raw | IV adjusted | ||||||
| Tiny | 33 | 524 | 463 | 0.65 | 0.74 | ||||||
| Small | 644 | 8,406 | 8,016 | 0.80 | 0.83 | ||||||
| Medium | 1,256 | 13,129 | 13,051 | 0.99 | 1.00 | ||||||
| Large | 1,128 | 9,741 | 10,273 | 1.20 | 1.14 | ||||||
| Overseas | 0 | 8 | 5 | 0.00 | 0.00 | ||||||
| TOTAL | 3,061 | 31,808 | 31,808 |
Table 5: Handicap race results 2012 wins/runs/IVs/adjusted IVs by stable classification
Whilst there is some improvement in Impact Values for smaller yards, the IV of 0.83 is equivalent to 17% fewer winners than expected. Medium sized yards again deliver wins in-line with expectations, whilst large yards deliver more wins in handicaps than expected with an IV of 1.14.
Average Horse Age & Yard Classification
A possible explanation for smaller yards posting IVs lower than 1 in handicaps is that they keep a greater proportion of exposed horses in training. A proxy for an exposed horse is its age. The average horse age by stable classification, split by Pattern races and Handicaps, is given in Table 6 below.
| Yard Size | Pattern Horse Age (average) | Handicaps Horse Age (average) | |||
| Tiny | 4.9 | 4.9 | |||
| Small | 5.7 | 6.5 | |||
| Medium | 5.0 | 5.5 | |||
| Large | 4.2 | 5.2 | |||
| Overseas | 5.1 | 6.0 |
Table 6: Average horse age by stable classification
The table confirms that small yards have, on average, older horses in training than medium and large yards. This is the case for both Pattern and Handicap races. Whilst an age difference would only favour younger horses in Pattern races if the WFA scale is incorrect, the difference in horse age in handicaps by yard classification suggests that small yards are running more exposed horses than larger yards, and this is a contributory factor in them posting IVs less than 1 in such races.
Summary
So do small training yards punch above their weight? There are a large number of small training yards in Great Britain and Ireland. In 2012 they were responsible, in aggregate, for about a quarter of the runners in flat handicaps. Small yard representation in Pattern races in 2012 was far less, accounting for fewer than 7% of runners. Moreover, given this number of runners, the percentage of winners from small yards was less than might be expected, even after a correction for horse quality is applied. The Impact Value for small training yards was 0.47 in Pattern races, although it is possible that the correction for horse quality applied, via Sire Impact Values, does not go far enough. It could be that the best offspring of a Sire end up at the larger yards and the smaller yards end up with (say) the less good Galileo yearlings. The correction used would not account for this.
In Handicaps the Impact Value for smaller yards was 0.83 in 2012, in contrast larger yards posted an IV of 1.14. One explanation for the difference in performance in handicaps is that the smaller yards are running more exposed horses. The difference in horse age across yard size suggests this is the case. Another explanation for the performance difference is that there is substantial value in having more horses in training because it enables the trainer to categorise his horses more accurately, which leads to better placing.
The results presented suggest that it is the large training yards that are the ones punching above their weight. Training a large number of horses in one yard, whilst being able to keep the average horse age lower than smaller yards, appears to confer a substantial advantage in terms of the results produced on the racecourse.
