Full Siblings On The Racecourse – Deja Vu All Over Again?

Introduction

At the 2015 yearling sales full-siblings to a number of talented racehorses were offered for sale. These included a full-sister to Group 1 winning filly Mecca’s Angel, sold for £825,000, a full brother to Group 1 winning colt Prince Gibraltar, sold for €100,000 and a full sister to dual Arc winner Treve, led out of the ring unsold at €1.2m.

The attraction of younger siblings is clear to both buyers, hoping to replicate the success of the older sibling, and to breeders, expecting juicy prices at the sales.

In the analysis presented below we compare full-sibling racecourse performance, and compare with half-siblings performance from the same dam.

Analysis

Using RaceForm (RF) data,  4,334 sibling pairs that had reached the racecourse were identified. Since we are most interested in sibling pairs when the eldest sibling has performed well on the racecourse, the pairs were filtered  to those where the eldest has performed to a Racing Post Rating (RPR) of at least 100. In Table 1 below the median RPR and percentage of the younger siblings to reach an RPR of 100 are shown. There are 984 qualifying pairs, and the median rating of the younger sibling is 84, 25lb worse than the median rating of the elder sibling group, with ca. one-quarter going on to achieve an RPR in excess of 100.

Sibling                      Qualifiers            Median RPR                    Pct RPR100

Elder                              984                             109                                            100.0%

Younger                        984                               84                                             25.4%

Table 1: Full-sibling performance compared

So how does this compare with half-sibling performance from the same set of dams? In Table 2 below the performance of half-sibling pairs where the eldest half-sibling ran to an RPR of 100 are shown. Dams were restricted to the 4,334 that produced the sibling pairs that formed the basis of the analysis in Table 1. There are 497 qualifying pairs, and the median rating of the younger sibling is 80, 28lb worse than the median rating of the elder sibling group, with ca. one-fifth going on to achieve an RPR in excess of 100.

Half-Sibling       Qualifiers                Median RPR                    Pct RPR100

Elder                              497                             108                                            100.0%

Younger                        497                               80                                             19.1%

Table 2: Half-sibling performance compared

Summary

Buying a full-sibling to a racehorse that has achieved an RPR of 100 has given you about a one-quarter chance of repeating the outcome, and has improved your chances relative to buying the half-sibling to an RPR100 horse by ca. 30%. By way of comparison, ca. 7.7% of lots sold at Tattersalls Book One in 2007 went on to achieve pattern class success.

Given the difference in performance full- to half- siblings is just 4lb, it is possible this difference could be explained by differences in the ability of the sires visited by the dams.

Further analysis looking into sire differences, as well as an investigation of prices paid for younger siblings, would be of interest.

Yearling Sales vs. Breeze Ups: Where Should You Buy?

Introduction

There are two options for buying racehorses with a flat campaign in mind – the Yearling Sales or Breeze Ups. At the Yearling Sales, which take place in the Autumn, horses are sold unbroken, wheras at the Breeze Ups, which take place the following Spring, part of the sales process is that the horses catalogued breeze for 2 furlongs. Breeze times are used by many as an input into their buying decision. Breeze Up sales have their critics. Young horses being pushed too hard, too young, with a preparation  that instills poor habits (‘boiled brains’), horses do not train on and are more prone to a lack of soundness. Added to that is a perception that horses sold at the Breeze Ups are expensive for what you get. There also exists the perfect totem for Breeze Up critics – The Green Monkey, who breezed in sub 10 seconds, was bought for $16m by Coolmore and never won a race. So is what happened with The Green Monkey indicative of what happens with many Breeze Up graduates? Or can a variant of Godwin’s Law be invoked, so that anyone who mentions The Green Monkey in a discussion regarding the merits of Breeze Up sales has automatically lost the argument? In this blog post the graduates from  Tattersalls Yearling Sales from the Autumn of 2011 are compared with the graduates from the Spring 2012 Breeze Up Sales that took place at Kempton (Ready to Run), Tattersalls Guineas, Tattersalls Craven and DBS. Racecourse performance is compared, along with prices paid.

Methodology

The analysis that underpins this piece was carried out in the R statistical environment accessing Raceform Interactive (RFI) data. This is the same data used by the Racing Post.  Sales information and racecourse performances (wins, runs, ratings) for the 2012 and 2013 flat seasons were collected. For analysis of racecourse performance horses were categorised as coming from either yearling sales, or breeze ups. Horses that sold at more than one sale were placed according to the category of the latest sale.

Catalogue Numbers, Appearance Rates and Withdrawals

Table 1 shows the number of horses in each sale category and the number of horses that went on to compete in a race. the appearance rate for Breeze Ups is 72%, higher than that for the Yearling Sales. The underlying data is from RFI, which records all GB and Irish racing and higher grade overseas races. Sales graduates that raced overseas at a lower level will not be included and so there is a degree of under-reporting in Table 1.  It is possible the Yearling Sales would be more affected by this than the Breeze Ups when overseas buyers are considered, even taking this into account there is little evidence that horses prepared for Breeze Ups are less likely to reach the racecourse.

The withdrawn columns show the numbers/percentages of horses that are withdrawn from sale but subsequently race. The withdrawal rate is twice as high for Breeze Ups. Because horses have to do more at the Breeze Ups than the Yearling Sales, it is not surprising a higher withdrawal rate exists. Consignors do not wish to jeopardise the sale value by sending horses to the Breeze Ups that are not ready to do themselves justice.

Category Catalogued Raced Raced (%) Withdrawn Withdrawn
Yearling Sales 1670 1137 68% 78 4.7%
Breeze Ups 601 434 72% 58 9.7%
Grand Total 2271 1571 69% 136 6.0%

Table 1: Catalogue sizes, appearances and withdrawals by category

Sales Prices

Table 2 shows the number of horses that were sold by category, as well as median, average and maximum prices. Sales exclude vendor buybacks and horses not sold, and the yearling sale numbers exclude those horses that went on to be sold at Breeze Ups. The median sale price was £38,000 at the Yearling Sales and £30,000 at the Breeze Ups. Averages and maximum sale prices were also higher for the Yearling Sales.  These numbers exclude any saving on training fees that accrues from buying ca. 6 months later at the Breeze Ups.

Category Number Median (£) Average (£) Maximum (£)
Yearling Sales 809      38,000             65,972   700,000
Breeze Ups 291      30,000             42,711   300,000

Table 2: Sale Information by category

Ratings Achieved by Sale Category

Table 3 shows, for each sale category, the median of the maximum rating achieved by each horse over its racing career in 2012 (2 year old) and 2013 (3 year old). Medians are also given for ratings achieved first time out, and considering the racing career in 2012 as a 2 year old only. The results for Yearling Sales and Breeze Ups are very similar. At the end of their 2 year old career ratings are both 69. At the end of their 3 year old career they are both 74. Horses sold at both types of sale are of similar quality and progress similarly from age 2 to age 3.

Ratings for first time out runs are lower for Breeze Up horses at 57.5 versus 60 for Yearling Sales graduates. This is an unexpected result. Breeze Up horses progress further from their first run to their maximum than horses sold at the Yearling Sales. The difference isn’t large, however the view that Breeze Up horses are as ready as they can be for racing isn’t borne out by the data. A possible explanation is as follows: Breeze Up consignors are concerned to get their horses to the sales, not wanting them to break down, as a result they veer on the side of caution and under rather than over prepare their horses. When these horses arrive with trainers, they fear the horses have been over prepared, given the reputation that exists for Breeze Up graduates, and the horses are trained more cautiously than Yearling Sales graduates that have been in their charge for longer. The end result is that Breeze Up graduates post lower ratings first time out than Yearling Sales graduates.

Category Rating Rating 1TO Rating 2yo Highest Rated
Yearling Sales 74 60 69 118
Breeze Ups 74 57.5 69 118

Table 3: Ratings by category

Win Rates and Runs per Horse

Win rates for Yearling Sales and Breeze Ups are similar, with 58% of Breeze Up and 55% of Yearling Sale graduates going on to win races. The number of runs per horse is higher for Breeze Ups graduates. The difference is 1.2 races per horse when all races as a 2 year old and 3 year old are considered. It is possible that the Breeze Up preparation selects horses that are able to withstand racing, and buyers are able to identify these horses at the Breeze Ups.

Category Win Rate Runs/Horse all Runs/Horse 2yo
Yearling Sales 55.3%                7.5                    3.7
Breeze Ups 58.0%                8.7                    4.2

Table 4: Win rates and runs per horse

Summary

A comparison of  racecourse performance and sales prices for ca. 1,500 Yearling Sale (2011) and Breeze Up (2012) graduates shows the following:

  • Breeze Up horses sold more cheaply
  • A similar proportion of horses reached the racecourse
  • Ratings achieved were similar
  • Breeze Up horses progressed somewhat more from first run to their maximum rating
  • Win rates were similar
  • Breeze Up horses ran more often

There is little evidence that the criticisms levelled at Breeze Ups are justified, with both types of sale offering opportunities to buyers.

More detailed performance information is available from www.breezeupwinners.com

Does Buying at Tattersalls Book 1 Lead To Guaranteed Success? Prices Paid vs. Racecourse Performance For The 2007 Graduates

Introduction

Record prices paid at the recent Tattersalls 2013 Book 1 Yearling Sale have hit the headlines. A Galileo filly, full sister to Oaks winner Was, sold for a record breaking G5m (G = guineas). The median price paid for a yearling came in at G130,000, an increase of 30% over 2012. Today (14th October 2013) the Book 2 sale starts, followed by Book 3 one week later. Yearling are categorised into the three books by Tattersalls based upon a range of criteria, including pedigree and confirmation. Book 1 is the most prestigious and its graduates typically sell for more than Book 2 graduates, which in turn sell for more than Book 3 graduates.  So how do the graduates of Tattersalls Yearling Sales perform on the racecourse? In common with all of the sales companies any Tattersalls graduate winning a prestigious race results in a tweet and/or email proclaiming where the horse was sold. But how do the graduates of the sales perform in aggregate? Trainer George Baker in a recent blog post alludes to the reality that some of these graduates will end up plying their trade at a basement level.  In this blog post the racecourse performance of all of the 2007 graduates from Books 1, 2 and 3 Tattersalls Yearling Sale is examined. The maximum rating achieved by each horse between 2008 and the end of the 2012 flat season was extracted from the Raceform database, including information from maidens, handicaps and pattern races and the ratings and race performance compared with their yearling sales price.

Yearling Sale Prices By Book

Over 1,500 yearlings were catalogued at Tattersalls Yearling Sale in 2007. Excluding those withdrawn, not sold or bought back, 1,136 yearlings were sold. The Book 1 median was G80,000, twice the Book 2 median of G40,000, with the Book 3 median coming in at G12,000.

Book Sold Median (G) Max (G)
1 447        80,000 1,000,000
2 393         40,000     300,000
3 296         12,000       72,000

Table 1: Tattersalls 2007 Yearling Sale Prices


Sale Prices & Subsequent Ratings

How do the graduates from this sale perform on the racecourse? Graph 1 below shows the relationship between prices paid and subsequent maximum rating achieved by each horse. The y axis has rating and the x axis sale price. The relationship is noisy. The correlation between price paid and subsequent rating is 0.20. If log prices are used so that the effect of some of the higher priced lots is dampened, the correlation increases to 0.28. At first glance it doesn’t appear as if much of a relationship exists at all. Does this suggest the work of bloodstock agents, trainers and owners trying to identify the best yearlings is of limited benefit?

Prices Vs. Ratings

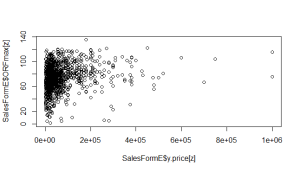
Graph 1: Tattersalls 2007 Yearling sale price (G) vs subsequent rating


Book Membership & Ratings Achieved

In common with much of the data in horse rating, aggregation enables relationships to be identified.  Table 2 gives the median rating achieved across all of the graduates for each of Books 1, 2 and 3. The best horse from Book 1 posted a rating of 135, the best horse in Books 2 and 3 posted similar ratings of 120 and 119 respectively. The median rating achieved by Book 1 graduates was 78, for Book 2 graduates 73.5 and for Book 3 graduates 68. So a relationship between price paid and subsequent rating does exist when the results are aggregated to the Book level. Note that improvements in ratings become progressively more expensive to buy. In trading up from Book 3 to 2, an extra G28,000 bought you an additional 5.5 points of rating, whilst in trading up from Book 2 to 1 you needed to spend an extra G40,000 to garner an additional 4.5 rating points.

Book Median Rating Max Rating
1 78 135
2 73.5 120
3 68 119

Table 2: Ratings achieved across Books 1, 2 & 3

Wins Rates in Maidens, Handicaps & Pattern Races

Table 3 gives the number of individual winners that came out of each book by race category, table 4 shows the same information expressed as a percentage of horses that sold in each book. The numbers do not sum to the total column because a horse can be a winner in each of the three race categories but only once in total. About half of all graduates from the Tattersalls 2007 Yearling Sales are still maidens and the proportion of yearlings that won at least one race seems to be little affected by the Book in which you wrre sold. However the benefits of buying from Book 1 become clear. Nearly twice as many graduates from Book 1 go on to win pattern races compared with the graduates of Books 2 and 3. Book 1 graduates also win the highest proportion of maidens. This result should probably be upgraded because they are likely to have to contest open maidens, which by their nature are the most competitive. Their sales price and stallion fee would preclude them from competing in auction and median auction races. There is also a knock on effect when open maiden horses go on to compete in handicaps. Race standards applied by the handicapper, allied to his ‘on a line through’ methodology, means that the handicap marks of Book 1 graduates may  leave less room for manoeuvre than the graduates of other books. It is also likely that Book 1 graduates will be trained with a view to possible Pattern company participation, thus competing in maiden company closer to full fitness than the graduates of other books. As a result Book 1 graduates that end up in handicaps could well be doing so on marks that most closely reflect their ability. All of these arguments can be reversed when the graduates of Book 3 are considered.

Book Maidens Handicaps Patterns Total
1 155 126 34 239
2 118 121 16 188
3 84 98 10 152
Total 357 345 60 579

Table 3: Individual winners by Book in Maidens, Handicaps & Pattern Races

Book Maidens Handicaps Patterns Total
1 34.7% 28.2% 7.6% 53.5%
2 30.0% 30.8% 4.1% 47.8%
3 28.4% 33.1% 3.4% 51.4%
All 31.4% 30.4% 5.3% 51.0%

Table 4: Percentage of individual winners by Book in Maidens, Handicaps & Pattern Races

Differentiation Within Books: Does Paying More Work Within Books?

In aggregate the more expensive horses perform better on the racecourse. Is there much difference in subsequent performance if the more expensive Book 1 graduates are compared with those that sold more cheaply from Book 1? Each Book was sorted and split into a top half and bottom half group based upon sale price. The median rating of each group was calculated. Table 5 shows the median price and rating for each of the top half and bottom half by Book. There is a clear relationship between sales price and subsequent rating within each book. In each book the difference is about the same at 9 rating points. The more expensive Book 1 graduates ended up with higher ratings than cheaper Book 1 yearlings. The same is true of Books 2 and 3. In each case the difference in median ratings is about 9 points. It is noteworthy that the incremental cost of each additional rating point depends on your starting rating. In Book 3 it costs G1,800 for every extra rating point, whilst in Book 2 it is G5,455 per point and in Book 1 G21,250. In this respect yearlings trade in much the same way as other trophy assets.

When pattern race winners are considered the more expensive graduates of Books 1 and 2 have more winners than those that sold more cheaply – it is most striking in Book 1, with 24 pattern race winners versus 10 from the bottom half. Table 6 gives this information by Book. The usual caveats apply with respect to interpretation given the small sample sizes.

When median ratings are compared the more expensive graduates of Book 1 performed best, followed by the more expensive graduates of Book 2. However the next best performer is a tie between the more expensive Book 3 graduates and the cheaper yearlings from Book 1.  Yet the more expensive Book 3 graduates have a median sales price less than half that of the cheaper Book 1 graduates, albeit with fewer pattern race winners. If there can ever be value in buying yearlings it appears that, at least in 2007, buying the most expensive Book 3 graduates paid off on the racecourse. It is possible this result is an artefact of the 2007 yearling draft, looking at the results from other years would answer this query.

Median Price Median Price Median Rating Median Rating
Book Top Half Bottom Half Top Half Bottom Half
1         165,000         46,500 82 73
2           70,000         24,000 79 69
3           21,000           6,500 73 64.5

Table 5: Prices paid and ratings within books


Book Top Half Bottom Half
1 24 10
2 10 6
3 6 4

Table 6: Pattern winners by book top and bottom half

Summary

Results from the Tattersalls Yearling Sale from 2007 show a noisy relationship between individual sales price and subsequent rating. However in aggregate the relationship becomes clear – the more expensive yearlings, taken as a group, subsequently performed better on the racecourse. It is when pattern races are considered that the benefits from buying at Book 1 were at their most apparent. The median sale in Book 2 took place at G40,000. In Book 1 this doubled to G80,000. Whilst it might seem poor value that spending twice as much resulted in an increase of just 4.5 rating points in the median ratings for Book1 versus Book 2, it nearly doubled the chances of buying a yearling that went on to win a pattern race. Yearlings are priced off the right had tail of the distribution of expected future ratings, and it is the right-hand skewness inherent in the expected future ratings of Book 1 yearlings that causes them to sell so much more expensively than yearlings catalogued in Books 2 and Book 3. The lottery ticket you buy when shopping at Book 1 has a much greater chance of coming up. When prices within Books are considered the same relationships are confirmed. Buying the more expensive graduates from within each Book resulted in higher ratings than attempting to bargain hunt amongst the cheaper yearlings in each Book. In Book 1 buying the more expensive yearlings resulted in nearly 2.5x as many pattern race winners. Now the noisiness of the relationship shown in Graph 1 above means that bargains were available at all prices and in all books, however the probability of buying a bargain yearling that subsequently performed well at the racecourse was maximised if you bought from amongst the more expensive Book 3 graduates.