Do Fast Consignors Achieve Fancy Prices? Evidence from the Breeze-Up Sales

Introduction

I’ve written about breeze-up sales in a previous blog piece, concluding that breeze-up sale graduates have much the same profile on the track as yearling sales graduates. First time out ratings are similar, as is the level of improvement from first run to best run.

Breeze-up sales are not without their critics. A number of these criticisms are addressed in an article I co-authored with James Willoughby for Mark Johnston’s March 2015 edition of The Kingsley Klarion. James and I consulted for Mark and Simon Crisford at the breeze-up sales in 2015, and also consulted at the yearling and foal sales in 2015 for a number of clients.

The focus of this article is to examine the relationship between breeze times, sales prices, run frequency and subsequent racecourse performance, but aggregated to the consignor level. This enables the following questions to be answered:

  • Do consignors that produce faster breezers achieve higher sales prices?
  • Do consignors that produce faster breezers achieve higher or lower subsequent ratings?
  • Do consignors that produce faster breezers achieve it at the expense of subsequently running less often?

Data

We have collected breeze times at a variety of European breeze-up sales in the last few years. Our proprietary database runs to over 2,000 lots offered and links each horse to their subsequent racecourse performance. In the analysis below information is aggregated to the consignor level, with medians used as the summary measure. Averages were  also examined and show similar results. Consignors offering fewer than 15 lots in total in our dataset were excluded from the analysis.

Analysis

Breeze Times and Sales Prices

In Graph 1 below the relationship between median relative breeze time on the x-axis and median sales price on the y-axis is shown. Each point represents a consignor. Consignors whose graduates breeze more quickly are on the left hand side of the graph, higher prices are at the top of the graph. There is little relationship between breeze time and prices achieved. Those consignors that typically produces fast breezers do not guarantee high sales aggregates for their lots.


Graph1
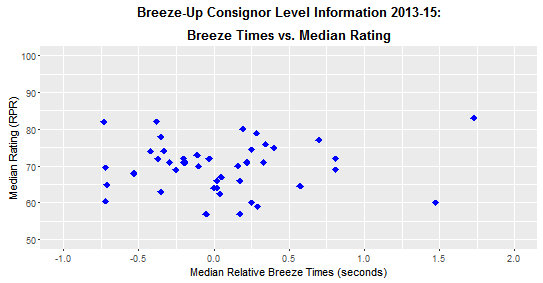
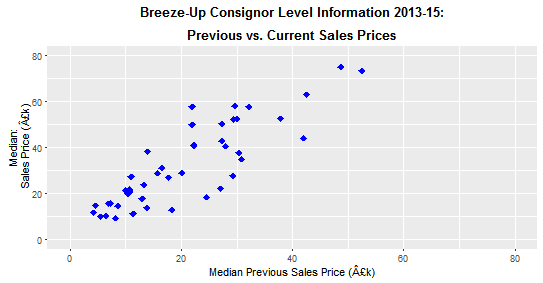
Graph 1: breeze times & sales prices


Breeze Times and Subsequent Ratings

In Graph 2 below the relationship between median relative breeze time on the x-axis and subsequent median of maximum Racing Post Rating (RPR) on the y-axis is shown. Consignors whose graduates breeze more quickly are on the left hand side of the graph. There is little relationship. Those consignors that typically produces fast breezers do not guarantee high or low ratings for their lots.

Graph3

Graph 2: breeze times & subsequent ratings

Breeze Times and Run Frequency

In Graph 3 below the relationship between median relative breeze time on the x-axis and run frequency on the y-axis is shown. Consignors whose graduates breeze more quickly are on the left hand side of the graph. There is little relationship. Consignors with fast breezers do not appear to compromise the subsequent ability of horses to be able to run regularly.

Graph4

Graph 3: breeze times & run frequency

Previous and Current Sale Prices

In Graph 4 below the relationship between previous (x-axis) and current (y-axis) sale prices are shown. There is a strong relationship. The strongest predictor of the aggregate sales price a consignor will achieve at the breeze-ups is the previous aggregate price paid at the yearling sales. Previous prices will reflect the view of the yearling market regarding pedigree quality, physical attributes and conformation. With the breeze-up sales taking place less than a year after the yearling sales, it is unsurprising that the attributes that were important in determining price at the yearling sales were also important to prospective purchasers at the breeze-ups.

Graph5

Graph 4: current and previous sale prices


Catalogue sizes & prices at the Tattersalls 2015 yearling sales

Introduction

The yearling sales season for 2015 is almost over. Tattersalls catalogued 2,109 yearlings in 2015 across Books One, Two and Three, compared with 1,890 in 2014. Whilst median prices in Books One and Two were similar in 2015 compared with 2014, Book Three aggregates were down, with a 22% fall in median prices. 

Analysis

Whilst aggregate prices were down, we noticed during Book Three that earlier lots were selling for higher prices than lots catalogued later in the sale. In Graph 1 below a moving average of prices relative to the sale median is shown in lot order. There is a pedigree quality correction included in prices to account for differences in pedigrees between lots, and vendor buybacks an unsold lots are excluded. Lots were catalogued on both days according to dam name, in order from W to V. Prices achieved were lower on day two relative to day one. Pedigrees were less good on day two relative to day one, which explains the difference that can be seen in day one (up to lot 1773) and day two (lot 1774 onwards) . However just looking at day two prices were 20% to 40% lower towards the end of the day than at the beginning. These are large numbers. Given lots are catalogued in order of the first letter of the name of the dam by day, it wasn’t a year to be consigning a yearling out of a dam whose name began between R and V on day two.

Tatts2015Bk3MovAvg

Graph 1: Prices by lot number

Allied with prices, we can look at rates of vendor buybacks and unsold lots. See Graph 2 below, which charts a moving average of the rate of vendor/not sold lots in lot order. Consignors reacted to price falls by buying back their yearlings if reserves were not met.

Tatts2015Bk3VNSrate

Graph 2: VNS rate by lot number

Summary

With over 200 more lots catalogued by Tattersalls in 2015 relative to 2014, prices in Books One and Two held up well. The pressure was felt in Book Three, with earlier lots selling more expensively than lots catalogued later in the sale. It is possible lots on day two did not possess the physicals of lots catalogued earlier, however the analysis presented above includes a pedigree adjustment, and given lots are catalogued according to the name of the dam by day, it appears unlikely the physicals of later lots would be substantially inferior to those catalogued earlier on day two.

Full Siblings On The Racecourse – Deja Vu All Over Again?

Introduction

At the 2015 yearling sales full-siblings to a number of talented racehorses were offered for sale. These included a full-sister to Group 1 winning filly Mecca’s Angel, sold for £825,000, a full brother to Group 1 winning colt Prince Gibraltar, sold for €100,000 and a full sister to dual Arc winner Treve, led out of the ring unsold at €1.2m.

The attraction of younger siblings is clear to both buyers, hoping to replicate the success of the older sibling, and to breeders, expecting juicy prices at the sales.

In the analysis presented below we compare full-sibling racecourse performance, and compare with half-siblings performance from the same dam.

Analysis

Using RaceForm (RF) data,  4,334 sibling pairs that had reached the racecourse were identified. Since we are most interested in sibling pairs when the eldest sibling has performed well on the racecourse, the pairs were filtered  to those where the eldest has performed to a Racing Post Rating (RPR) of at least 100. In Table 1 below the median RPR and percentage of the younger siblings to reach an RPR of 100 are shown. There are 984 qualifying pairs, and the median rating of the younger sibling is 84, 25lb worse than the median rating of the elder sibling group, with ca. one-quarter going on to achieve an RPR in excess of 100.

Sibling                      Qualifiers            Median RPR                    Pct RPR100

Elder                              984                             109                                            100.0%

Younger                        984                               84                                             25.4%

Table 1: Full-sibling performance compared

So how does this compare with half-sibling performance from the same set of dams? In Table 2 below the performance of half-sibling pairs where the eldest half-sibling ran to an RPR of 100 are shown. Dams were restricted to the 4,334 that produced the sibling pairs that formed the basis of the analysis in Table 1. There are 497 qualifying pairs, and the median rating of the younger sibling is 80, 28lb worse than the median rating of the elder sibling group, with ca. one-fifth going on to achieve an RPR in excess of 100.

Half-Sibling       Qualifiers                Median RPR                    Pct RPR100

Elder                              497                             108                                            100.0%

Younger                        497                               80                                             19.1%

Table 2: Half-sibling performance compared

Summary

Buying a full-sibling to a racehorse that has achieved an RPR of 100 has given you about a one-quarter chance of repeating the outcome, and has improved your chances relative to buying the half-sibling to an RPR100 horse by ca. 30%. By way of comparison, ca. 7.7% of lots sold at Tattersalls Book One in 2007 went on to achieve pattern class success.

Given the difference in performance full- to half- siblings is just 4lb, it is possible this difference could be explained by differences in the ability of the sires visited by the dams.

Further analysis looking into sire differences, as well as an investigation of prices paid for younger siblings, would be of interest.

Do Bookmaker Restrictions Harm British Racing?

Introduction

The placing of restrictions on winning punters by bookmakers isn’t a new phenomenon. With bookmakers acting as principal in taking bets from punters, and thus exposed to potential losses by taking bets at fixed odds, it isn’t surprising that bookmakers take steps to limit such losses, either by placing limits on the amounts wagered or closing the accounts of those punters perceived to be consistently profitable.

What has changed in recent years is the proportion of bets placed on-line and the introduction of betting exchanges. On-line betting enables restrictions on punters to be placed more easily, whilst exchanges i) enable punters to arbitrage bookmaker odds, ii) give bookmakers market information that in previous times would have been gleaned by taking bets from informed punters, iii) provide competition and margin pressure for bookmakers and iv) decrease bookmaker flexibility in being able to take trading positions for or against horses because of the risk of arbitrage via the exchanges.

In the light of these changes to the market place it would be surprising if restrictions were not more prevalent than in the past, although bookmakers do argue that a relatively small proportion of punters are restricted and those that complain are ‘a vocal minority’ (Coral representative Simon Clare speaking on The Morning Line, 22nd March 2014). Since information about restrictions isn’t published by bookmakers, the true extent of restrictions placed is unknown. As the plural of anecdote is not data, the fact that the majority of people I know that bet on horses are restricted in some way by bookmakers is hard to use in an argument, so I will leave that for social media commentators and first look at bookmaker restrictions in the context of different types of punter.

Punter Categories

Arbitrageurs/Anomaly Players

If bookmaker prices are out of line with exchange prices these players will attempt to extract an arbitrage profit by laying their bets back via exchanges. The extent to which bets are laid back is not fully known, but it would be surprising if a significant proportion were not hedged. Pricewise in the Racing Post is the highest profile example of bookmakers placing restrictions on clients. Given Pricewise’s popularity it is hardly surprising restrictions are placed on those attempting to get on at advertised prices. In addition some bets can be placed that favour the punter over the bookmaker – commonly known as each-way thieving, including each-way doubles, and rule 4 deductions with odds-on horses withdrawn. It is difficult to have much sympathy with complaints about restrictions from arbitrageurs/anomaly players.

SP Predictors

Bets are placed at fixed odds with the expectation that SP will be shorter. Arbitrage isn’t possible at the time the bet is placed, this is about identifying mispricing in odds setting. Given the time and effort put into making tissues by the bookmaking firms, and the information available in exchange prices, consistently being able to beat SP without being privy to inside information requires skill, time and effort, and, in my view, is a rare commodity, and the population of SP predictors is overly represented by those with access to inside information.

The placing of restrictions on SP predictors by bookmakers is therefore a defensive reaction to the risks of being on the wrong side of inside information. There is a negative consequence to this, in that it is likely that these restrictions, erring on the side of caution, could well catch more punters than those with access to information, including punters with no skill, and thus reduce overall bookmaker profitability. The consequence of this is that racing, partly funded by bookmaker profits through the Levy, receives a lower level of funding than would otherwise be the case. So why would bookmakers, in business to make money, have a policy in place that acted to reduce their overall profitability? The answer lies in considering risk aversion. Does a bookmaker wish to make an almost certain profit of £100m, or have a 95% chance of making a profit of £105m and a 5% chance of making a profit of £90m? The probability weighted return from the latter scenario is £104.25m, yet the consequences of posting a £90m profit for the employees of the business would be severe. It is not difficult to imagine policies being put in place at bookmakers that meant the probability of making an almost certain £100m were maximised.

So is it possible to put policies in place that will reduce the 5% chance in the example above to a lower percentage, and as a consequence reduce the extent to which bookmakers felt the need to place restrictions on SP predictors? In my view this is about integrity. Quoting from the BHA’s website on Integrity Services: One of the key responsibilities for Racing’s regulator is to protect the integrity of the sport on and off the racecourse. Millions of pounds are bet each year on British racing, and for the sport to flourish and for racegoers and punters to be attracted to the sport, racing has to be, and seen to be, clean and fair.

In my view the integrity in British racing would be improved if the BHA’s Integrity Services group were charged with the collection and timely dissemination of the following information: spell/gallop records – it would be immediately obvious if a horse hadn’t had sight of the gallops for a while, or its preparation routine had changed so that it had undertaken an increase in work; horse weights – enabling changes and progression over the season to be tracked; veterinary records – wind operations, setbacks, treatments and the like would be known; jockey riding instructions –so that intentions, and changes in intention relative to usual instructions were known. Note that in many racing jurisdictions some or all of this information is already available to the public.

The consequence of publishing this information is that bookmakers would have more confidence in making prices in the face of reduced information asymmetry. They would be less exposed to the risks of insiders taking advantage of overly generous prices to those in the know. The need to place less reliance on betting restrictions as a source of risk control follows. In the recent Barney Curley inspired betting coup, it is difficult to imagine the horses involved receiving the same preparation as they had received for previous races, and publication of the above information would likely have highlighted this.

SP Players

The final category of punter is those that are successful betting at SP. This category is likely to still include insiders, however I’d expect them to form a lower proportion than the SP predictors group. At first sight it would seem obvious that restricting winning punters would increase bookmaker profits. Higher bookmaker profits mean a higher Levy, ergo restricting winning punters is good for racing. However the tricky bit here is the identification of winning punters. The returns from betting on horses are inherently noisy since the processes involved are probabilistic, not deterministic. So a good restrictions policy must be able to separate winning punters from those that have no skill and were simply in receipt of a lucky run. Why is this? Because the no skill punter is the bookmakers (and skilled punters) friend, likely in the future to contribute to the bookmakers (and skilled punters) profits. Restricting him at the top of a winning run is bad for business and bad for racing. So how easy is it to identify winning punters? In the absence of information about the algorithms used by bookmakers, an experiment is described below in which bookmaker restrictions were modelled.

Modelling Bookmaker Restrictions

No Skilled Players Model

A sequence of 250 ten runner races was set up with 50,000 individuals betting on the outcome of each race. Bets were placed by punters in proportion to fixed bookmaker odds (3/1, 4/1, 5/1, 11/2, 9/1, 14/1, 16/1, 25/1, 33/1, 40/1), with the odds for each race kept constant. The result for each race and the selection of each punter in each race was made randomly, with the race result probability in proportion to odds. This is a stylised representation of betting over the course of a year across the country. No punters were assumed to possess skill. Because of the over-round the majority of punters lost money by the end of the 250 race sequence. I make the assumption that bookmakers believe certain punters possess skill, and wish to restrict them from betting. We know this isn’t the case, with chance the only driver of returns. Since the only information the bookmakers can use is historic returns, an algorithm is set up that identifies so-called skilled punters who have, over the preceding 20 races, at least 1 successful bet in 3 and have a return of at least 75% on stakes over those 20 races. I have no knowledge of the actual algorithms used to restrict punters, but have chosen values with the knowledge that statistical tests of significance increase in power as i) the number of observations increases, ii) the size of the difference away from the null is increased and iii) the volatility of the effect is reduced. The algorithm described meets all three criteria, albeit with an arbitrary choice of values. The experiment described above is adjusted so that from race 20 onwards if a punter meets the restriction algorithm he is restricted from placing any further bets in subsequent races. At the end of the 250 races 7.2% of punters were restricted. This proportion is consistent with what we’re told about restrictions being applied to a minority of punters, vocal or otherwise. Table 1 below shows the effect on total stakes, punters and bookmaker profitability with the unrestricted case based as 100.

No Skilled Players Model            Unrestricted                       Restricted

Stakes                                                               100                                              94.2

Bookmaker Profit                                        100                                              92.3

Punters                                                            100                                              92.8

Winning Punters (%)                                32.4%                                            35.1%

Table 1: No Skilled Players Model summary statistics

The information in Table 1 shows the restriction algorithm generates a substantial number of false positives. As a result the overall number of players is reduced and bookmaker profits are reduced, leading to reduced funding for racing. Of course the experiment is designed to generate this exact false positive result. However it does enable comparison with a model in which some proportion of players are skilled. This is covered in the next section.

Skilled Players Model

What happens if a proportion of players are introduced that have skill? How many skilled punters does the algorithm detect, and what is the effect on overall bookmaker profitability now that skilled punters are part of the model?  Skilled players are assumed to have an edge of 7% (that is the probability of their picks being successful is increased by this amount) and comprise 10% of the overall universe of punters. Table 2 below contains the results.

Skilled Players Model             Unrestricted                            Restricted

Stakes                                                            100                                                       94.0

Bookmaker Profit                                    100                                                        92.0

Punters                                                        100                                                        92.5

Winning Punters (%)                           34.0%                                                     36.7%

Skilled Punters detected                    10.4%                                                   10.4%

Table 2: Skilled Players Model summary statistics

At the end of the 250 races 7.5% of punters were restricted. Only 10.4% of the skilled punters were detected, and the number of false positives identified is significant. The similarity between tables 1 and 2 is striking. The algorithm does a poor job of identifying skilled players. No doubt the algorithm outlined above is too simplistic, and the risk managers working for bookmakers will have designed sophisticated algorithms that are able to separate skilled players from the rest more successfully than the one suggested here. The body of literature surrounding the identification of signal (skilled punters) in the presence of noise (no skill punters) is substantial, and I’m sure this literature has been mined extensively by bookmakers in the pursuit of the best algorithms. However the data sets are noisy due to the nature of punting returns, and no matter how sophisticated the algorithms, the data sets themselves will set a limit on the ability to identify skilled punters. A natural reaction, particularly for those in charge of risk models, would be to err on the side of caution, which has the consequence of increasing the proportion of false positives, and restricting too many punters. Whilst it would seem irrational to act in a manner that reduces profitability, when risk considerations are taken into account for those in charge of risk models, the placing of restrictions on too many, rather than too few punters is a significant possibility. This has negative implications for the funding of British racing.

No Skill and Skilled Players Models Compared

A comparison of the No Skill and Skilled Player Models above demonstrate the difficulty in identifying skilled punters. Poorly defined account restriction models have the potential to harm British racing by placing restrictions on too many punters, leading to lower levels of funding for British racing than would otherwise be the case. In the experiments above, the restriction algorithm leads to a slow steady decline in the number of punters in the simulation. Is it a co-incidence many within British racing point to a slow steady decline in betting on British racing? Is it possible that account restrictions are a contributory factor?

In an earlier section I proposed that the BHA’s Integrity Services team take responsibility for the collection and dissemination of additional information that would benefit bookmakers in price setting. I further propose this team is given oversight of the account restriction algorithms used by bookmakers to restrict punters. Bookmakers would be expected to demonstrate the algorithms used minimised false positive detection rates. This additional responsibility would dovetail with the existing relationship that exists between the BHA and bookmakers, with the BHA writing on its website as follows: In recent years we have established a good working relationship with all of the established bookmakers and their umbrella association (Association of British Bookmakers). The betting industry, like the BHA, wants racing to be clean and willingly share information whenever they see suspicious betting activity.

Summary

Account restrictions are considered in terms of the types of bet placed. In the case of arbitrage and anomaly bets the placing of account restrictions seem a perfectly reasonable response on the part of bookmakers acting to protect their business. It would be difficult to argue restrictions placed upon this type of punter harms British racing. For account restrictions put in place to try and identify SP predictors (in my judgement comprising principally insiders) these restrictions are a direct consequence of the paucity of information supplied to punters. These restrictions are likely to harm the funding of British racing, but the culprit is the lack of information rather than the rational response of bookmakers desirous of minimising their exposure to a source of downside risk. An increase in the amount of information provided to punters as part of the BHA Integrity Services team is proposed, as well as being given oversight of the account restriction algorithms used by bookmakers, who will be expected to demonstrate they minimise false positive detection rates due to the risk of incorrectly specified algorithms resulting in a lower level of funding for British racing than would otherwise be the case.

Going and Trip Preferences

Introduction

At Newbury last Saturday Al Ferof ran in the Denman Chase and  Smad Place in the Novice Chase. Previously both horses had run below form when faced with, in Al Ferof’s case, the same 24 f Trip, and in Smad Place’s case, the same Heavy Going  they faced on Saturday. In Al Ferof’s case he ran 7lb below his previous best in the 24f King George VI Chase at Kempton on Boxing Day 2013, whilst Smad Place ran  13lb below his previous best on Heavy Going in the Long Walk Hurdle at Ascot in December 2012. So how important is previous form over the same Trip, or on the same Going, in assessing prospects when the same Trip or Going is faced again? On Saturday in Al Ferof’s case he again ran below form, wheras Smad Place went on to win his race, posting his highest chase rating to date.

Data, Universe & Method

The source of the data is Raceform Interactive (RFI) with the analysis carried out in the R statistical environment. National Hunt (NH) races in the database from  2006 up to early February 2014 are considered. Each time a horse runs its Racing Post Rating (RPR) is compared with the maximum RPR the horse has achieved up to and including race date. The difference between the two numbers is defined as the RPR relative (RPRrel). The maximum value RPR can achieve is zero. Following Timeform’s definition, if a horse runs within 5lb of its maximum rating it is considered to have Run To Form (RTF) – horses are then classified into two categories – either having RTF (given a 1) or below (given a 0). The Going on which races took place were classified into four categories: Quick, Good, Soft and Heavy. The distance over which races were run were classified into five Trip categories of: up to 17f, between 17f and 21f, between 21f and 25f, between 25f and 29f, and 29f plus.

To assess the importance of previous form given the Going or Trip, the RTF classification as at a particular race (1 or 0 ) is then compared with the RTF classification achieved (1 or 0) in its next race. All of the previous races at the Going or Trip are used to determine the classification, so if a horse has RTF on any occasion in the past it is allocated a 1. Horses that haven’t run on the Going or over the Trip are excluded.

In the jargon the result is a 2×2 contingency table for each Going and Trip category  that can be assessed for statistical significance using a chi-squared statistic.

Going Analysis

Each of the 2×2 contingency tables for the four Going categories is presented in Table 1 below, with the number of observations given in parentheses.  Classification by previous RTF is given in the first column, by subsequent performance in the second and third columns. Horses that have RTF in the past have about a one in three chance of repeating, for horses that haven’t RTF the chances are just over one in four. The results are highly statistically significant.

Quick (29,127) Below RTF   Good (134,422) Below RTF
Below 74% 26% Below 72% 28%
RTF 65% 35% RTF 68% 32%
Soft (46,127) Below RTF   Heavy (32,971) Below RTF
Below 74% 26% Below 75% 25%
RTF 68% 32% RTF 68% 32%

Table 1: 2×2 Contingency Tables (RTF vs. Below Form) for Going Categories

The extent of the difference in performance can be see in the graph below, which shows median differences for the four Going categories. Extremes of Going exhibit greater differences, with a range of between 1 and 3lbs.

GoingRTF

Trip Analysis

Each of the 2×2 contingency tables for the five Trip categories is presented in Table 2 below, with the number of observations given in parentheses. Classification by previous RTF is given in the first column, by subsequent performance in the second and third columns. Horses that have RTF in the past have a decreasing chance of delivering  a RTF performance next time out as Trip distance increases. This is probably because horses become more exposed as they are stepped up in Trip. In all cases, however, horses that have previously RTF outperform those that have not.  The results are again highly statistically significant.

up to 17f (86,133) Below RTF   17f – 21f (91,666) Below RTF
Below 66% 34% Below 74% 26%
RTF 61% 39% RTF 68% 32%
21f – 25f (65,248) Below RTF   25f – 29f (9,036) Below RTF
Below 78% 22% Below 80% 20%
RTF 71% 29% RTF 75% 25%
29f plus (1,565) Below RTF
Below 85% 15%
RTF 79% 21%

Table2: 2×2 Contingency Tables (RTF vs. Below Form) for Trip Categories

The extent of the difference in performance can be see in the graph below, which shows median differences for the five Trip categories. Differences are greatest when horses race between 21f – 29f. There is no difference in medians at 29f plus, however there is a difference in means.

TripRTF

Summary

If a horse has previously RTF over a particular type of Going or Trip in NH races, it is significantly more likely to do so than horses that have not. Differences in probabilities are between 5-7%, ratios substantially higher. The difference in median performance ranges between 0 and 3lbs. One possible confounding influence is the effect of horses that run consistently to form regardless of Going or Trip. However if this were the overriding effect it might be expected that the difference in performance seen in the graphs would be constant across Going and Trip categories. This is not the case. Analysis using ANOVA (analysis of variance) would answer this concern more fully.

Running to Form: Days Off, Consistency and Race Type

Introduction

Prior to the recent running of 2014’s Cleeve Hurdle, Timeform’s Micheal Williamson blogged on the relationship between days off and the chances of horses running to form, with the backdrop of Big Buck’s long-awaited return to action. By coincidence I was in the middle of some analysis on the same subject, partly in anticipation of the start of the Flat season. The focus of this blog piece is the relationship between days off, consistency, race type and runs to form (RTF) for Flat and National Hunt (NH) races.

Data, Method & Universe

The source of the data is Raceform Interactive (RFI) with the analysis carried out in the R statistical environment. Flat and NH races are considered separately. Races in GB and Ireland only since 2007 up to mid-January 2014 are considered. Each time a horse runs its Racing Post Rating (RPR) is compared with the maximum RPR the horse has achieved up to and including race date. The difference between the two numbers is defined as the RPR relative (RPRrel). The maximum value RPR can achieve is zero. Following Timeform’s definition, if a horse runs within 5lb of its maximum rating it is considered to have Run To Form (RTF). Horses are classified as having either high or low consistency according to the percentage of times a horse has RTF relative to a cut-off of 50%. The choice of 50% is arbitrary. No allowance is made for the number of times a horse runs, or its age in assigning a consistency classification, even though the older/more often a horse runs the more likely it is to run more than 5lb below its previous best. Races are classified as either handicaps, pattern races or other. For Flat races the analysis is restricted to  horses aged 4 and above. The reason for this is to reduce the influence on the analysis of the return to racing after a long break of unexposed,  previously immature horses. For similar reasons in NH races the analysis is restricted to horses aged 5 and above. Days off between races are classified into the following 6 buckets: up to 10 days, 10 to 29 days, 30 to 59 days (1m to 2m), 60 to 179 days (3m to 6m), 180 to 364 days (6m to 1y) and 365 to 730 days (1y to 2y).

Analysis & Results

Days Off & Performance on the Flat

Table 1 shows the average RPRrel for each days off bucket.  The number of runs per days off bucket is also given.  Horses run closest to form with a break of less than a month between races, there is then a gradual deterioration in performance as the time between runs lengthens until an improvement of ca. 0.5lb with a break of between 6 months and a year, it is possible this is the period when horses are returning after a voluntary winter rather than enforced mid-season break.  Horses with a break of more than a year perform ca. 3lb worse on return than average.

Days Off Category Runs Runs% RPRrel avg (lb)
1 < 10 days           38,561 17.8% -19.4
2 10 to 29 days         110,358 50.9% -19.3
3 1m to 2m           32,299 14.9% -19.8
4 3m to 6m           19,995 9.2% -20.8
5 6m to 1y           13,012 6.0% -20.3
6 1y to 2y             2,602 1.2% -22.8
TOTAL         216,827 100.0% -19.6

Table 1: Breakdown of  runs and RPRrel by days off category – Flat

Days Off, Performance & Consistency on the Flat

Graph 1 below shows the deterioration in performance by bucket of days off by consistency. The rate of deterioration is similar for both categories. High consistency horses typically run ca. 13 lbs better than low consistency horses.

G2PerfConsisFlat

Graph 1: Days Off, Performance & Consistency on the Flat

Days Off, Performance & Race Type on the Flat

Graph 2 shows the deterioration in performance according to race type. In handicaps the deterioration in performance for a lay-off of more than a year is marked. Pattern race performers are not as affected by breaks, although also perform less well after a break of more than a year. The ‘other’ category is a ragbag of maidens, claimers, sellers and conditions races with results that are perverse relative to handicaps and pattern races.

G2PerfRtypeMk3

Graph 2: Days Off, Performance & Race Type on the Flat

Days Off & Performance for National Hunt Races

Table 2 shows the average RPRrel for each days off bucket for NH races.  The number of runs per days off bucket is also given.  Horses run closest to form with a break of less than 10 days or with a break of between 1 and 2 months. Longer breaks are associated with a deterioration in performance, with no equivalent upwards blip to that seen in Flat racing associated with breaks of between 6 months and a year. The rigours of National Hunt racing suggests racing that requires a longer recovery period and where improvement for the first run of the season should be expected. Horses running after a break of more than a year perform slightly worse than 3lb relative to the average.

Days Off Category Runs Runs% RPRrel avg (lb)
1 < 10 days           19,818 7.6% -17.6
2 10 to 29 days         117,268 45.2% -18.1
3 1m to 2m           57,475 22.2% -17.7
4 3m to 6m           33,380 12.9% -19.0
5 6m to 1y           23,425 9.0% -19.4
6 1y to 2y             7,826 3.0% -21.6
TOTAL         259,192 100.0% -18.3

Table 2: Breakdown of runs and RPRrel  by days off category – NH

Days Off & Consistency for National Hunt Races

Graph 3 below shows the deterioration in performance by bucket of days off by consistency. The rate of deterioration is similar for both categories. High consistency horses typically run 15 lbs better than low consistency horses. National Hunt and Flat exhibit similar patterns.

G3PerfConsisNH

Graph 3: Days Off, Performance & Consistency for National Hunt

Days Off, Performance & Race Type for National Hunt Races

Graph 4 shows the deterioration in performance according to race type. Handicaps show deterioration in performance as the length of lay-off increases, with a marked drop for lay-offs of more than a year. In pattern races there appears to be a sweet spot of between 10 days and six months where horses have produced their best performances. Perhaps the recent trend for top class horses to be campaigned sparingly is justified. Lay-offs of longer than six months are more negative. In NH races the ‘Other’ category is less of a rag bag, containing maiden and novice races. The results here probably reflect progressive horses posting new ratings highs and are therefore of less use in determining what relationship exists between days off and performance.

G4PerfRTypeNH

Graph 4: Days Off, Performance & Race Type for National Hunt

Summary

There is strong relationship between days between runs and running to form. There are substantial differences in the results from handicaps versus pattern races, and whether a horse has exhibited consistency in the past, and all of these factors need taking into account in deciding upon the prospects for a horse in the context of how many days since it has last raced. There are some differences in the results between the Flat and National Hunt, and these differences are consistent with NH types needing a somewhat longer recovery period and benefiting from their first run of the season. In common with Timeform’s findings there is little evidence of the received wisdom that modern training methods mean long layoffs are less of an issue is true, even when the data is split into pre- and post-2010 time periods. It is probably the case that the successful return to action of a few high profile, high consistency pattern race performers, who on the evidence presented above are likely to run reasonably close to their previous best, has caused this view to gain common currency.

Owners Facilities Reviewed: York, Wincanton, Goodwood, Sedgefield, Huntingdon

York (Baytown Kestrel, Flying Bear)

York gives the impression that it has thought hard about how to make owners and spectators happy. I usually travel to York races on the train but this year took the car to the busy August festival. The owners car park is organised for quick entry and get away. Kim Bailey writes about how he’d like to see this introduced for owners car parks at UK racecourses. I can see why as it works very well. The owners building at York is brilliantly positioned, with a balcony that on one side overlooks the paddock and on the other the finishing line. You couldn’t wish for better viewing. The dining room is excellent – food is close to Ascot standards, albeit you have to pay. Canny Yorkshire folk. But I don’t mind at all – it’s good value. The owners bar was very busy. By mid afternoon sitting/standing outside was a more comfortable option, but with it being York’s August festival it’s understandable. York possesses a charm few courses in the country can match and it is a pleasure to own/part-own a horse running at the course.

Rating:     😀                                 😀                           😀                    😀                 😀

Wincanton (Douchkirk, Heath Hunter)

Wincanton states in the letter you receive when your horse is entered for a race at the course that “our owners facilities are some of the best in Jumps racing”. Hmmmmmm – they need to get out more. With a few minor changes they could be, but they aren’t there yet. There are usually queues for owners badges on arrival, the owners facility is very crowded with nowhere to sit and there are long queues for food. The ‘hot local pie’ on offer was, sadly, passed over due to the queues in favour of wanting to see some racing.  Views of the finish are good from the owners bar, but then you have to face the scrum inside to get a drink or go to the paddock. It’s interesting that Wincanton has an arrangement that ROA membership gives you access to the owners facility. I’m not an ROA member. I know Rachel Hood, ROA Chief Executive would find this ‘extraordinary’, consider it because ‘I’m not sufficiently immersed in racing‘  or wish to ‘free ride‘ on the efforts the ROA makes on behalf of owners. She wrote as much in the July 2012 edition of Owner Breeder magazine. Maybe that article was a parody and I’m not in on the joke. What I do know is that if racecourses such as Wincanton, with capacity constrained owners facilities, have arrangements with the ROA so that its members can use those facilities even if they don’t have a horse running, and that usage detracting from the experience of owners with runners on the day, those racecourses and the ROA are doing a disservice to those owners that do have runners and, in the long run, to all owners. In Wincanton’s defence the Clerk of the Course has stated its badge arrangements with the ROA are being reviewed and they are also looking at how to alleviate the overcrowding and queues. A few minor changes here and there and Wincanton could be miles better.

Rating:             😀                    😀

Sedgefield (Innsbruck, Heath Hunter)

Sedgefield looks after owners. Decent food in the owners bar, plenty of places to sit and a jolly atmosphere. The course itself is the epitome of weekday National Hunt racing. Viewing is ok, but none of the stands have the height to make it exceptional for anyone. If you’re lucky enough to have a winner you are looked after very well with a photograph of your winning horse in a frame presented to you within short order of the race having finished. A nice touch.

Rating:         😀                           😀                    😀                 😀

Huntingdon (Dr. Darcey)           

You’d think on a rare sunny day in February that three people sitting on a deserted set of steps each drinking a cup of tea wouldn’t raise an eyebrow. When those steps are outside the owners enclosure opposite the winning post at Huntingdon racecourse it’s an occasion for the security guards to move in. Apparently the health and safety risks were too great for us to continue with our reckless tea drinking. No matter the tea was in a pathetic little paper cup with a sad teabag bobbing up and down within it – the spillage risk was too great for Mr & Mrs HiViz to bear. You’d think a featureless racecourse next to a motorway  that doesn’t have a fixture list to set the world alight might want to differentiate itself as a course based upon, say, friendliness, or facilities, or, I don’t know a decent hot meal, or tea served in china cups, or something, anything (!) that suggests a bit of effort. No chance. Huntingdon fails and fails badly. I can only imagine that Huntingon and Newbury raceourses are twinned. Huntingdon is a course to avoid as an owner.

Rating:  none

Goodwood (Silken Thoughts, Platinum Proof, Palazzo Bianco, Flying Bear)

Goodwood has plenty going for it as a racecourse. A wonderful setting and home to the fantastic Glorious Goodwood festival. The amount of racing gives many owners a shot at having a runner there.  Plus the course hasn’t messed things up as it has expanded – certainly not for owners. The views from owners seats at Goodwood is the best of any racecourse in the country. The owners pavilion is stylish with an excellent choice of food, and whilst it gets busy service is good. Food and drink isn’t cheap, but it hardly seems to matter. If you grab a table paddock side on a sunny day, where else would you rather be?

Rating:     😀                                 😀                           😀                    😀                 😀

Owners Facilities Reviewed : Ascot, Bath, Cheltenham, Newbury and Wolverhampton

Ascot (Flying Bear, Palazzo Bianco)

The best owners experience in the country. Whilst there are some aspects of the new stand that don’t quite work as well as they could – too much space between the paddock side and track side in the interior of the stand, sight lines in some places that aren’t perfect, the interior too hot in the Summer, too cold in the Winter, these are minor quibbles. Ascot probably receives some criticism because it is the flagship track in the country with the highest standards expected.  By contrast Cheltenham, given its facilities, gets away with little criticism. The Ascot owners facility overlooks the pre-parade ring, an inspired placement on the part of the architects team that were responsible for the re-design of Ascot.  The owners facility is in two parts – a bar and a dining room. The food in the dining room is a wedding style buffet. Top quality – and free to boot. The wine list has some gems, too. The bar next door is very comfortable and has large picture windows that open to allow you a view of the pre-parade ring.In the stands owners viewing isn’t quite opposite the finishing post but is close enough. Organising badges, and for Royal Ascot, paddock passes, all very easy. The staff were friendly, efficient and welcoming.  Going racing as an owner at Ascot is a pleasure. I’ve also had the good fortune to be part-owner of a horse that won at Ascot. There were plenty of families with young children in our party, and winning connections were made to feel entirely at home, even in spite of the impromptu creche that had been created. Hats off to Ascot.

Rating out of 5:       😀         😀           😀           😀             😀

Bath (Dr. Darcey, Orla’s Rainbow, Baytown Kestrel)

ARC, owners of Bath, have started to make more of an effort with owners, and things have improved noticeably in 2013 versus previous years. It’s still tough to get a seat in the owners area, but the food choice is much improved with a separate, albeit somewhat soulless, dining room at the back with a decent choice. The paddock area is close by, and whilst I don’t recall an area for owners viewing it’s never a problem to find  a spot in the stand with both a decent view of the course and close to the finishing line.

Rating out of 5:        😀         😀

Cheltenham (Alcalde)

I hope the redevelopment of Cheltenham results in an improvement in it’s owners facilities. Whilst the food on offer in the temporary marquee was decent enough, the large round tables mean you feel as if you are at a large wedding where you don’t know many guests. The owners bar is placed down near the 1f pole and is reminiscent of a 1950’s pub gone to seed. Owners viewing isn’t great either, further from the finish line than ideal – I’d choose to stand nearer the finish where the viewing is better.  For many people the pleasure of having a runner at Cheltenham outweighs the owners experience. I remember going to watch England play at Wembley in the 1970s. I didn’t notice the facilities were rubbish because of the wonder of  being at the match. I wouldn’t put Cheltenham in the rubbish category, but as the home of jumps racing its owners facilities should match those on offer at Ascot.

Rating out of 5:        😀         😀

Newbury (Alcalde, Silken Thoughts)

Oh dear. An excellent racecourse with clueless management and inefficient, officious staff. I’m of the view that the quality and behaviour of a management team in a business is reflected in the attitudes of its staff towards customers, and in the case of Newbury I hope the current search for a new Chief Executive results in an appointment from outside the current management team. Whoever is appointed can then, hopefully as a priority, sort out the treatment of owners and customers. There is also an atmosphere at Newbury that contrasts with that existing at the majority of other racecourses in the UK. It may have something to do with the cavernous Oktoberfest-style drinking halls, both permanent and temporary,  that exist. A re-design of these may improve matters here. My last visit as an owner to Newbury suffered from the following: queues for owners badges, no record of e-mail requests for badges at the owners desk, with questioning from the staff that suggested it was my fault they hadn’t read the e-mail, paddock stewards intent on preventing my teenage sons from entering the paddock with me, officious stewards at the owners facility, an uncomfortably crowded owners facility with no space to sit down, queues for drinks at the owners bar, and a long wait for food orders – we gave up and went to the on course fish and chip shop, where the food is decent and the service exemplary – in contrast to that experienced almost everywhere elsewhere on course. To put the tin hat on it our car was broken into in the owners car park. More security staff in the car park rather than acting as the fashion police might help here.  Newbury is a racecourse that benefits from an excellent fixture list and proximity to Lambourn. Good horses end up running at the course almost by default. The racecourse ought to be able to turn these benefits to its advantage. Yet it is a business which has lost money 4 years in the last 5 with no growth in turnover and attendance figures described as disappointing by the Chairman in reporting on its interim results last month.  Whilst these might be problems generic to racing, it is also a course that unlike others has had problems with mass brawls, fines for under-age drinking, the placement of concert stages for music nights so that viewing of the home straight is obscured, and horses being electrocuted in the paddock. The latest dress code furore can be added to the list of pratfalls that appear to be the speciality of  Newbury’s management team, which doesn’t appear to have made a connection between disappointing attendance figures, imposing a dress code and poor customer service. At the moment a course to avoid as an owner.

Rating out of 5: none

Wolverhampton (Magic Ice, Platinum Proof)

Wolverhampton offers decent facilities for owners. There is a good sized owners bar/room, decent hearty food on offer with viewing of the paddock from one end of the room and viewing of the track from the other. So why don’t I look forward to having runners at the track? It’s probably because the whole is so much less than the sum of the parts. There isn’t much of an atmosphere and the racing doesn’t inspire. But that is more my problem than that of the track – but in terms of being looked after, Wolverhampton does a decent job for owners.

Rating out of 5:    😀           😀             😀