Introduction
Prior to the recent running of 2014’s Cleeve Hurdle, Timeform’s Micheal Williamson blogged on the relationship between days off and the chances of horses running to form, with the backdrop of Big Buck’s long-awaited return to action. By coincidence I was in the middle of some analysis on the same subject, partly in anticipation of the start of the Flat season. The focus of this blog piece is the relationship between days off, consistency, race type and runs to form (RTF) for Flat and National Hunt (NH) races.
Data, Method & Universe
The source of the data is Raceform Interactive (RFI) with the analysis carried out in the R statistical environment. Flat and NH races are considered separately. Races in GB and Ireland only since 2007 up to mid-January 2014 are considered. Each time a horse runs its Racing Post Rating (RPR) is compared with the maximum RPR the horse has achieved up to and including race date. The difference between the two numbers is defined as the RPR relative (RPRrel). The maximum value RPR can achieve is zero. Following Timeform’s definition, if a horse runs within 5lb of its maximum rating it is considered to have Run To Form (RTF). Horses are classified as having either high or low consistency according to the percentage of times a horse has RTF relative to a cut-off of 50%. The choice of 50% is arbitrary. No allowance is made for the number of times a horse runs, or its age in assigning a consistency classification, even though the older/more often a horse runs the more likely it is to run more than 5lb below its previous best. Races are classified as either handicaps, pattern races or other. For Flat races the analysis is restricted to horses aged 4 and above. The reason for this is to reduce the influence on the analysis of the return to racing after a long break of unexposed, previously immature horses. For similar reasons in NH races the analysis is restricted to horses aged 5 and above. Days off between races are classified into the following 6 buckets: up to 10 days, 10 to 29 days, 30 to 59 days (1m to 2m), 60 to 179 days (3m to 6m), 180 to 364 days (6m to 1y) and 365 to 730 days (1y to 2y).
Analysis & Results
Days Off & Performance on the Flat
Table 1 shows the average RPRrel for each days off bucket. The number of runs per days off bucket is also given. Horses run closest to form with a break of less than a month between races, there is then a gradual deterioration in performance as the time between runs lengthens until an improvement of ca. 0.5lb with a break of between 6 months and a year, it is possible this is the period when horses are returning after a voluntary winter rather than enforced mid-season break. Horses with a break of more than a year perform ca. 3lb worse on return than average.
| Days Off | Category | Runs | Runs% | RPRrel avg (lb) |
| 1 | < 10 days | 38,561 | 17.8% | -19.4 |
| 2 | 10 to 29 days | 110,358 | 50.9% | -19.3 |
| 3 | 1m to 2m | 32,299 | 14.9% | -19.8 |
| 4 | 3m to 6m | 19,995 | 9.2% | -20.8 |
| 5 | 6m to 1y | 13,012 | 6.0% | -20.3 |
| 6 | 1y to 2y | 2,602 | 1.2% | -22.8 |
| TOTAL | 216,827 | 100.0% | -19.6 |
Table 1: Breakdown of runs and RPRrel by days off category – Flat
Days Off, Performance & Consistency on the Flat
Graph 1 below shows the deterioration in performance by bucket of days off by consistency. The rate of deterioration is similar for both categories. High consistency horses typically run ca. 13 lbs better than low consistency horses.

Graph 1: Days Off, Performance & Consistency on the Flat
Days Off, Performance & Race Type on the Flat
Graph 2 shows the deterioration in performance according to race type. In handicaps the deterioration in performance for a lay-off of more than a year is marked. Pattern race performers are not as affected by breaks, although also perform less well after a break of more than a year. The ‘other’ category is a ragbag of maidens, claimers, sellers and conditions races with results that are perverse relative to handicaps and pattern races.

Graph 2: Days Off, Performance & Race Type on the Flat
Days Off & Performance for National Hunt Races
Table 2 shows the average RPRrel for each days off bucket for NH races. The number of runs per days off bucket is also given. Horses run closest to form with a break of less than 10 days or with a break of between 1 and 2 months. Longer breaks are associated with a deterioration in performance, with no equivalent upwards blip to that seen in Flat racing associated with breaks of between 6 months and a year. The rigours of National Hunt racing suggests racing that requires a longer recovery period and where improvement for the first run of the season should be expected. Horses running after a break of more than a year perform slightly worse than 3lb relative to the average.
| Days Off | Category | Runs | Runs% | RPRrel avg (lb) |
| 1 | < 10 days | 19,818 | 7.6% | -17.6 |
| 2 | 10 to 29 days | 117,268 | 45.2% | -18.1 |
| 3 | 1m to 2m | 57,475 | 22.2% | -17.7 |
| 4 | 3m to 6m | 33,380 | 12.9% | -19.0 |
| 5 | 6m to 1y | 23,425 | 9.0% | -19.4 |
| 6 | 1y to 2y | 7,826 | 3.0% | -21.6 |
| TOTAL | 259,192 | 100.0% | -18.3 |
Table 2: Breakdown of runs and RPRrel by days off category – NH
Days Off & Consistency for National Hunt Races
Graph 3 below shows the deterioration in performance by bucket of days off by consistency. The rate of deterioration is similar for both categories. High consistency horses typically run 15 lbs better than low consistency horses. National Hunt and Flat exhibit similar patterns.
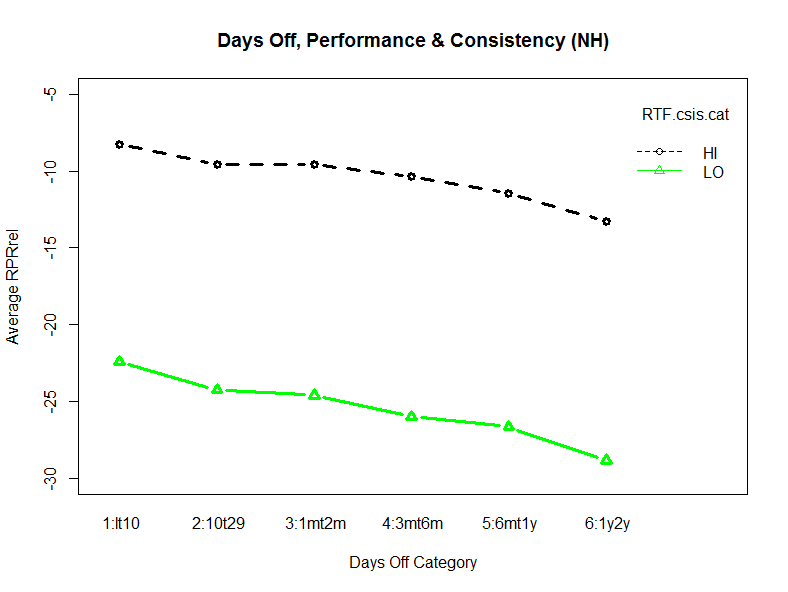
Graph 3: Days Off, Performance & Consistency for National Hunt
Days Off, Performance & Race Type for National Hunt Races
Graph 4 shows the deterioration in performance according to race type. Handicaps show deterioration in performance as the length of lay-off increases, with a marked drop for lay-offs of more than a year. In pattern races there appears to be a sweet spot of between 10 days and six months where horses have produced their best performances. Perhaps the recent trend for top class horses to be campaigned sparingly is justified. Lay-offs of longer than six months are more negative. In NH races the ‘Other’ category is less of a rag bag, containing maiden and novice races. The results here probably reflect progressive horses posting new ratings highs and are therefore of less use in determining what relationship exists between days off and performance.
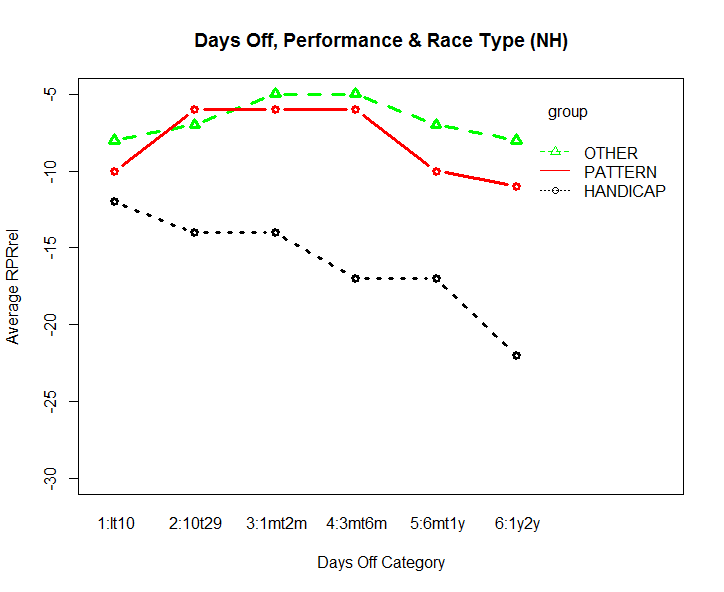
Graph 4: Days Off, Performance & Race Type for National Hunt
Summary
There is strong relationship between days between runs and running to form. There are substantial differences in the results from handicaps versus pattern races, and whether a horse has exhibited consistency in the past, and all of these factors need taking into account in deciding upon the prospects for a horse in the context of how many days since it has last raced. There are some differences in the results between the Flat and National Hunt, and these differences are consistent with NH types needing a somewhat longer recovery period and benefiting from their first run of the season. In common with Timeform’s findings there is little evidence of the received wisdom that modern training methods mean long layoffs are less of an issue is true, even when the data is split into pre- and post-2010 time periods. It is probably the case that the successful return to action of a few high profile, high consistency pattern race performers, who on the evidence presented above are likely to run reasonably close to their previous best, has caused this view to gain common currency.
