Introduction
The distance that horses finish relative to each other in horse racing is an important consideration in deciding what rating to apply to each horse post-race by public and private handicappers. Whilst it is obvious that trip will affect winning distances, what of going, field size and race class? To what extent do these factors make a contribution, and does the official handicapper take these factors into account in handicapping horses post-race?
Method, Dataset & Definitions
The analysis that underpins this piece was carried out in the R statistical environment accessing Raceform Interactive (RI) data for turf handicap races that took place during the 2011, 2012 and 2013 flat seasons in Great Britain. Races were placed into categories as follows:
Trip – Sprint (up to 6.5f), Mile (6.5-9.5f), Mid-distance (9.5-12.5f) and Long-distance (12.5f+)
Going – Heavy (HY), Soft (S), Good-Soft (GS), Good (G), Good-Firm (GF) and Firm (F)
Field Size – Tiny (fewer than 4 runners), Small (5 to 12 runners) and Large (more than 12 runners)
Race Class – High (Classes 1, 2 and 3) and Low (Classes 4, 5 and 6)
The number of races that took place in each category is given in Table 1 below.
| Trip | 2011 | 2012 | 2013 |
| LONG | 494 | 483 | 510 |
| MID | 450 | 421 | 448 |
| MILE | 1145 | 1103 | 1170 |
| SPRINT | 350 | 339 | 348 |
Table 1: Number of races by year by trip
Ground classifications used were those applied by RI rather than the official going. Proportions of races by Going category are given in Table 2a below. The effect of the wet weather in 2012 and dry summer in 2013 can be seen in the proportion of races that took place on the Soft and on Good-Firm in each year.
| Going | 2011 | 2012 | 2013 |
| F | 0.0% | 0.6% | 0.6% |
| GF | 14.4% | 14.6% | 22.3% |
| G | 65.5% | 41.1% | 57.4% |
| GS | 14.8% | 21.7% | 12.6% |
| S | 4.7% | 17.1% | 5.9% |
| HY | 0.5% | 4.9% | 1.2% |
Table 2a: Proportion of races by year by going category
The number of races by year by Field Size is given in Table 2b below. Field Sizes fell in 2013. The argument that fast going was responsible for the drop in Field Sizes is spurious. In 2011 there were 287 races on GF with small Field Sizes. In 2012 this decreased slightly to 262 races. In 2013 there was a substantial increase to 475 races. Other factors are responsible for the drop experienced in 2013.
| Field Sizes | 2011 | 2012 | 2013 |
| LARGE | 576 | 574 | 491 |
| SMALL | 1863 | 1772 | 1985 |
| TINY | 52 | 32 | 120 |
Table 2b: Number of races by year by field size
In Table 2c below the relationship between Race Class and Field Size is shown. As expected there is a greater proportion of High Class races with Large Field Sizes. In the analysis that follows races categorised as TINY were excluded from the analysis.
| Race Class | LARGE | SMALL | TINY |
| HIGH | 558 | 963 | 29 |
| LOW | 1083 | 4656 | 175 |
Table 2c: Number of races by class and field size
Winning Distances and Going
Graph 1 below shows winning distances by Trip for each Going category. Winning distance is defined as the distance between the winner of a race and the horse coming third. There aren’t many races that take place on Firm Going and as a result its black line representation on the graph should be treated with caution. Notice how winning distances are similar for the GS, G and GF categories, wheras for Soft and Heavy Going winning distances are quite different. There is also a non-linear relationship between winning distance and Going as Trip increases in distance. The minimum number of categories of Going that best describes winning distances is three: Heavy, Soft and an amalgamation of the other Going categories. We know from Table 2a that few races take place on Heavy going. As a consequence excluding these races, rather than amalgamating with the Soft going category, will improve the balance of the analysis that follows.
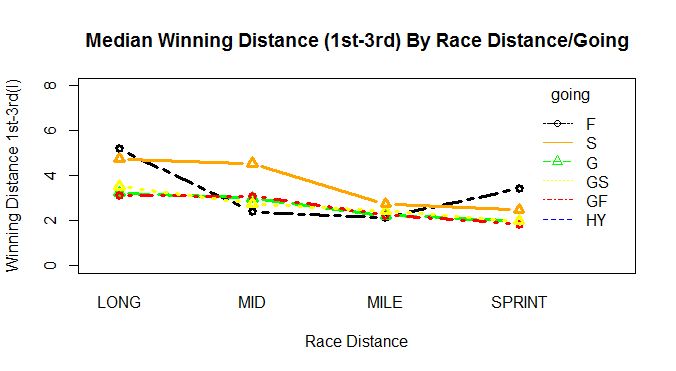
Graph 1: Winning distance by going category
Winning Distance and Race Class
On average winning distances are higher in Low Class races. Graph 2 below shows median winning distance by Trip by Race Class. The relationship is linear with trip for Low Class races. For High Class longer distance races the median winning distance is lower than for mid distance races. This is counter intuitive. It could be explained by High Class long distance races being run at a different pace – more of a crawl and sprint, resulting in compressed winning distances, rather than an end to end gallop.

Graph 2: Winning distance and Race Class
Winning Distance and Field Size
Winning distances are higher in Small Field Size races. Graph 3 below shows the median winning distance for Small and Large Field Sizes. It is possible the Field Size and Race Class winning distance effects are related due to the high relative proportion of High Class races with Large Field Sizes.

Graph 3: Winning Distance and Field Size
Contributions to Winning Distances
The information presented above shows that winning distances are affected by Trip, Going, Field Size and Race Class. Since some of these categories are related to each other analysis of variance (ANOVA) is used to attempt to disentangle the effects and see if all or just a subset of categories are important. In addition we can identify interaction (non-linear) effects, such as that between winning distance and Going. In Table 3 below a summary of the ANOVA table is presented. Apart from the obvious result that Trip and Going are highly significant in terms of explaining winning distances, Field Size and Race Class are important in their own right. In addition two interaction variables are included – Trip with Going and Trip with Race Class. The former is intuitive, the latter less so.
Category F Value p-value
Trip 187.626 2e-16
Going 91.278 2e-16
Field Size 85.227 2e-16
Race Class 64.553 1e-15
Trip*Going 8.237 2e-05
Trip*Class 6.904 0.000122
Table 3: ANOVA table of contributions to Winning Distance
Winning distances and Subsequent Handicap Changes
The official handicapper has detailed his policy with respect to handicapping here. Given the wide range of inputs that he states go into his handicapping decisions, we should find a relationship between changes in handicap mark and the race categories examined in the previous section. A variable that takes into account handicap mark changes and winning distances is defined as follows:
lbPerL = (Mark change for winner – Mark change for 3rd)/(Winning distance 1st-3rd)
Graph 4 below shows winning distance on the x-axis and handicap changes winner to third on the y-axis. Whilst there is a relationship (correlation=0.6) there are other factors in addition to winning distances that are used to revise handicap ratings.
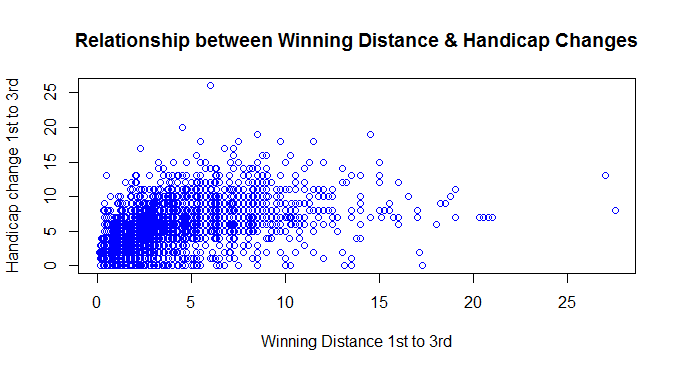
Graph 4: Winning distance and handicap changes
Pounds Per Length and Going
Handicap changes per length are lower for races that take place in Soft going. The median difference is 0.25 lbperL. So for with winning distances of 2 lengths, median handicap changes in Soft going are ca. 0.5lb less than on quicker Going.
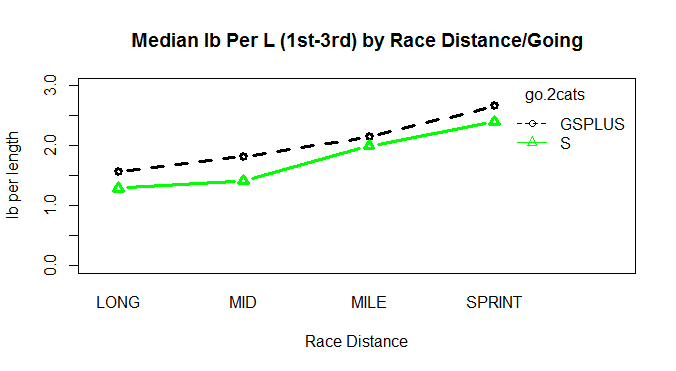
Graph 5: Pounds per Length and Going
Pounds Per Length and Race Class
Handicap changes per length are higher for High Class races. The difference is 0.34 lbperL. With winning distances lower in High Class races, it appears as if the handicapper applies a standard handicap increase to the rating of winners regardless of Race Class.
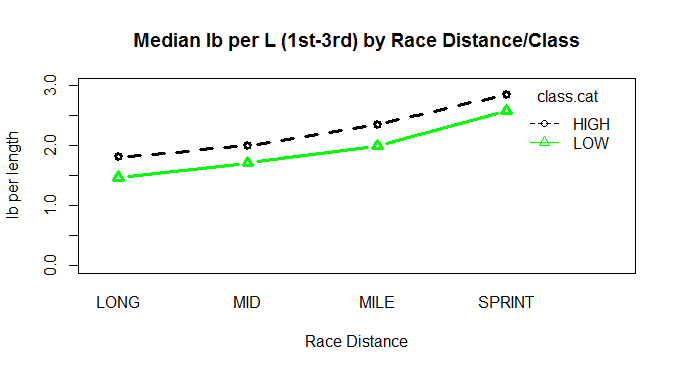
Graph 6: Pounds per Length and Race Class
Pounds Per Length and Field Size
Handicap changes per length are higher for races with larger Field Sizes. The difference is 0.33 lbperL. As with Race Class, it appears as if the handicapper applies a standard handicap increase to the rating of winners regardless of Field Size.

Graph 7: Pounds per Length and Field Size
Understanding the Contributors to Handicap Changes
ANOVA is used to check if the differences seen in the graphs above are statistically significant. Table 4 below shows the handicapper does take into account Going, Field Size and Race Class in the handicap changes he applies to winning horses – the p-values show that each category explains a significant component of the lbperL variable. In the next section we examine if sufficient account is taken of the different race categories.
Category F Value p-value
Trip 106.119 < 2e-16
Going 27.191 1.90e-07
Race Class 45.673 1.52e-11
Field Size 42.151 9.10e-11
Table 4: Contributors to Winning Distances
Is Sufficient Account Taken of Different Race Categories?
If the handicapper takes sufficient account of race categories it should be the case that horses run equally well in their next race. The variable PctBtn (thanks to Simon Rowlands of Timeform for suggesting this variable, for example here) is defined as the percentage of horses beaten next time out by the winner of each race. If the handicapper has done his job, there should be no difference in the average PctBtn variable by race category. ANOVA is used again. Table 5 contains the results. The results for Field Size are statistically significant. It appears as if the handicapper does not raise the handicap mark of winners of large Field Size races by enough, since they beat a higher proportion of their rivals next time out than winners of races in other categories.
Category F Value p-value
Trip 0.442 0.7230
Race Class 0.098 0.7545
Field Size 4.821 0.0282
Going 0.668 0.4137
Table 5: Contributors to Winning Distances
Summary
In addition to the obvious effect of Trip and Going on winning distances, Field Sizes and Race Class are also significant contributors. Whilst the handicapper appears to take these factors into account in setting handicap marks, in the case of large fields size handicap winners it appears that winners are insufficiently penalised. It is a small step to suggest that placed horses from large Field Size races are worthy of particular attention next time out.
